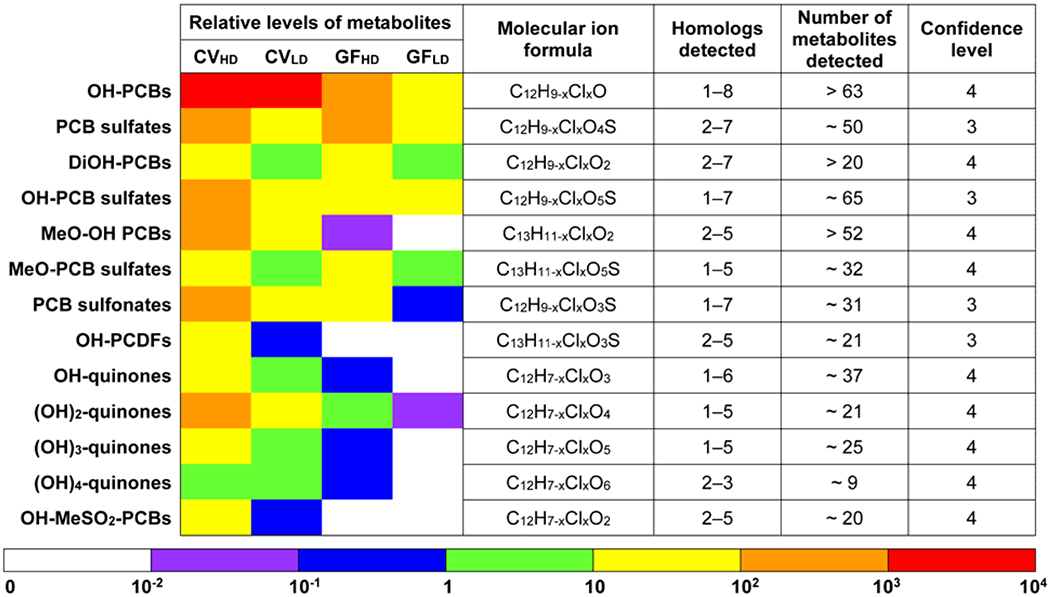
Figure 1.

A heatmap-style comparison of the relative levels of the sum of the PCB metabolites (Pmetabolites) and a summary of the PCB metabolites detected in feces from CV and GF mice exposed orally to the Fox River Mixture. Confidence levels were assigned as described (Schymanski et al., 2014). Briefly, a confidence level of 3 represents tentative PCB metabolites with possible structures but an unconfirmed position of substituents. A confidence level of 4 describes PCB metabolites identified based on the molecular formula and the isotope pattern.
