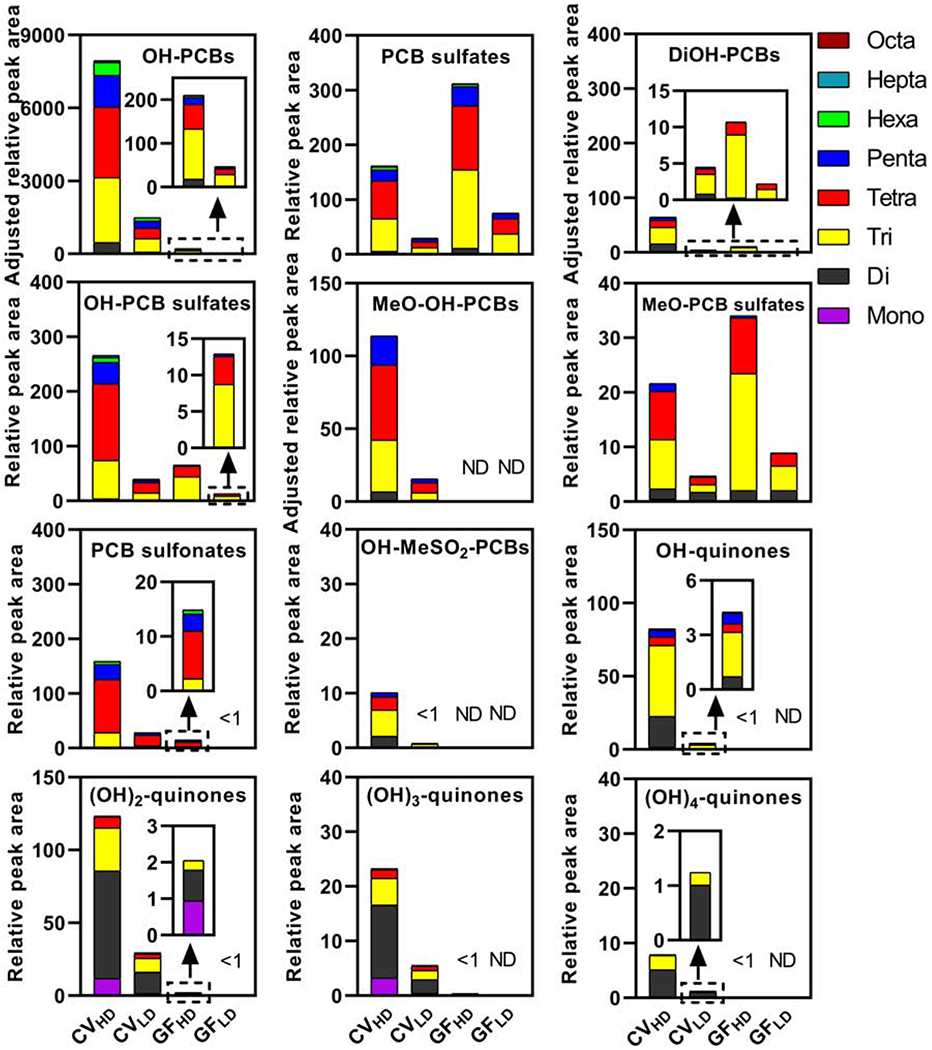
Figure 3.

The sum of the relative peak area of selected major PCB metabolites in the 24 h exposure period shows dose- and gut microbiome-dependent differences in feces samples from CV and GF mice. Data are the sum of the peak areas of PCB metabolites adjusted by the internal standard and the feces weight to account for the different amount of feces excreted over 24 h by CV vs. GF mice. For the relative peak areas of metabolites by class and homolog group, see Table S1–2.
