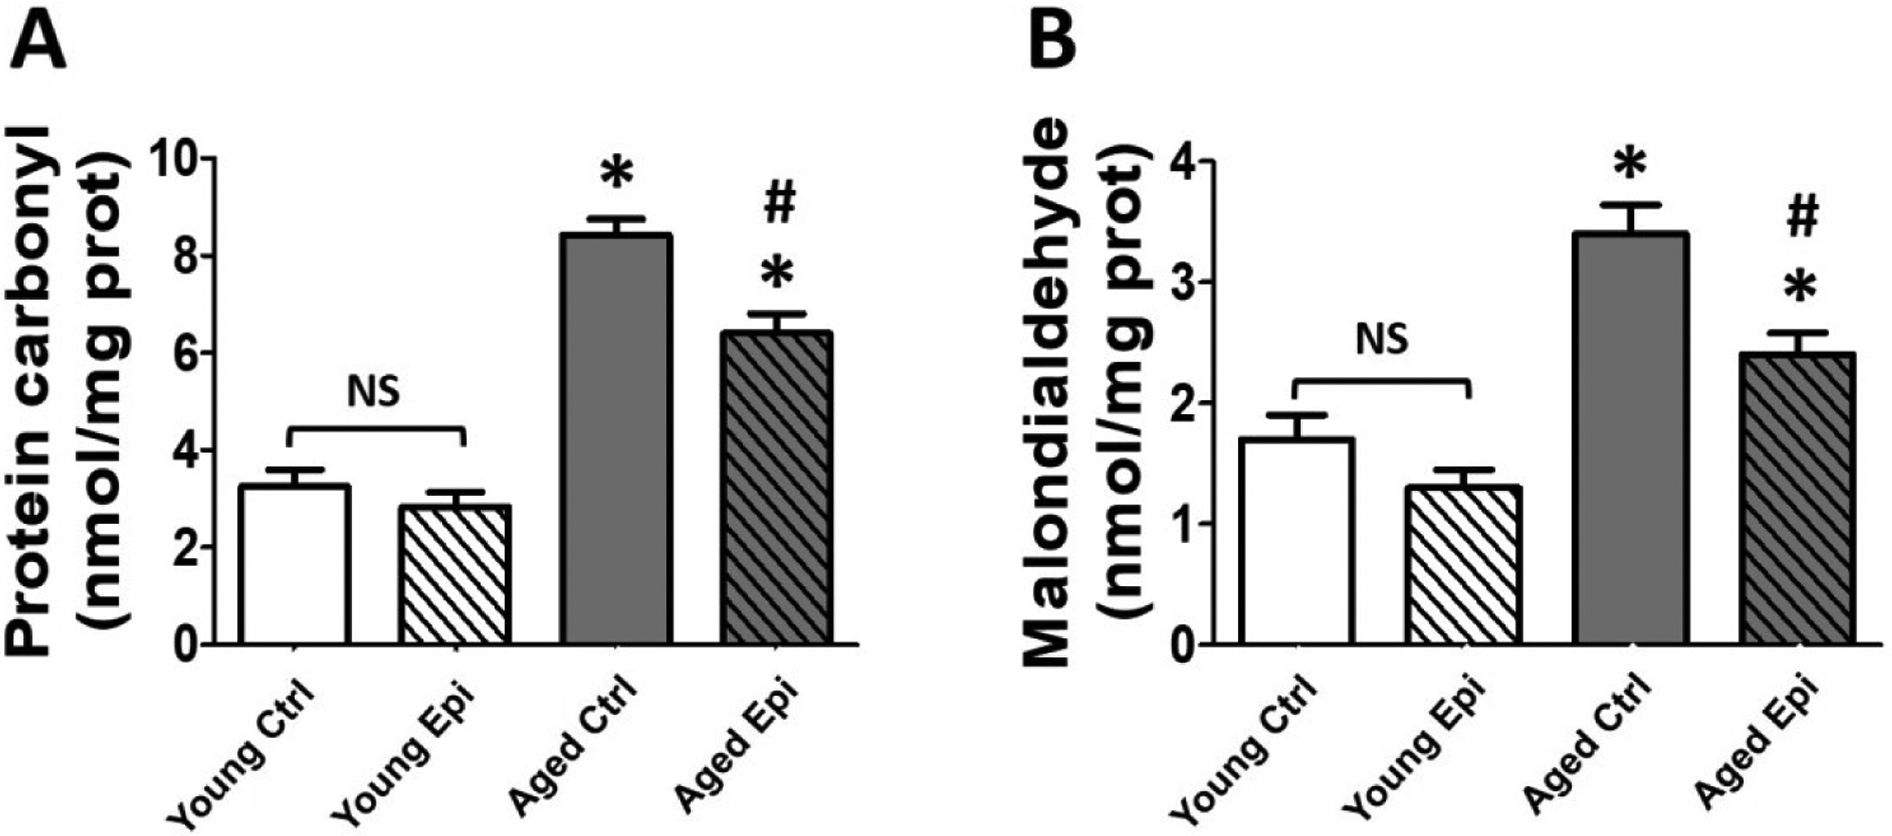
Figure 1.

Oxidative stress indicators level in the hippocampus of young and aged control (YC and AC) and epicatechin treated mice (YE and AE). (A) Changes observed in total protein carbonylation levels. (B) Changes observed in malondialdehyde-bound thiobarbituric acid (MDA) levels. Values were normalized by sample protein content (n = 7/ group, *p < 0.05 vs. YC, #p < 0.05 vs. AC).
