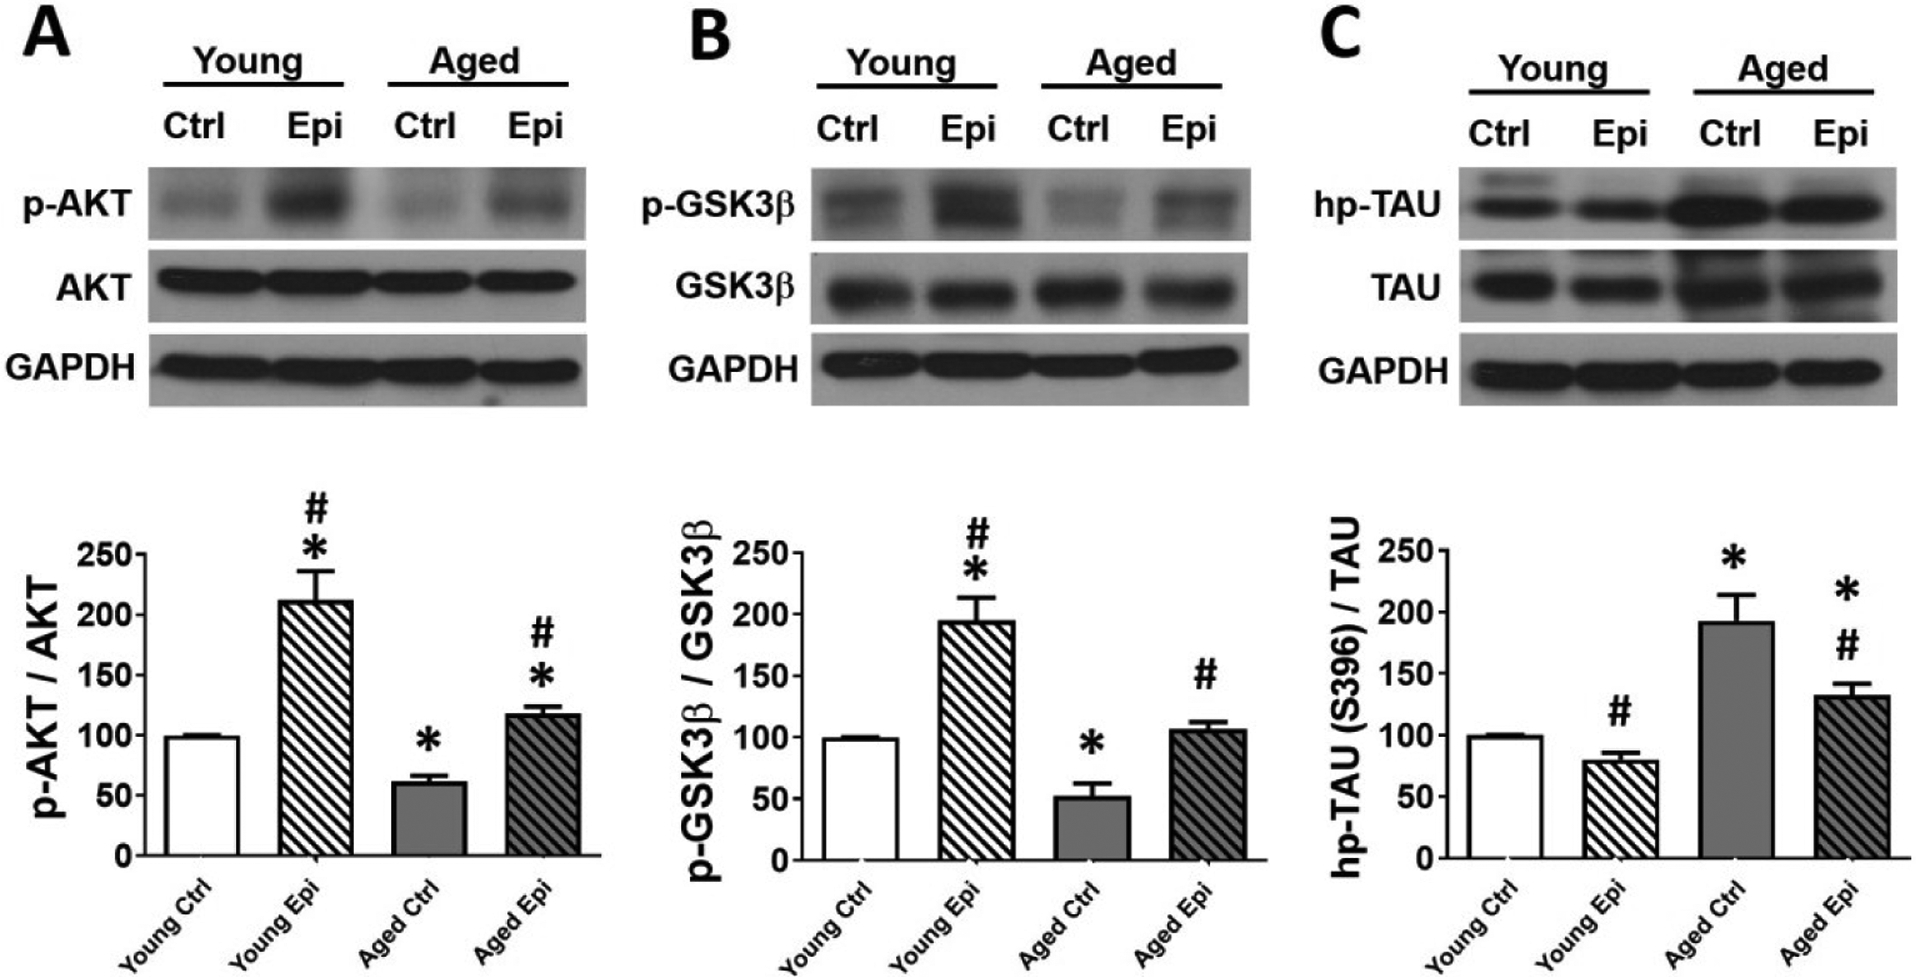
Figure 4.

AKT, GSK3β and TAU total and phosphorylated relative protein levels in the hippocampus of young and aged control (YC and AC) and epicatechin treated mice (YE and AE). (A) Representative Western blot images observed in p-AKT (A), p-GSK3β (B) and hp-Tau (C). Protein levels are reported relative to total protein with YC values set as 100%. Protein levels were normalized using GAPDH values (n = 7/ group, *p < 0.05 vs. YC, #p < 0.05 vs. AC).
