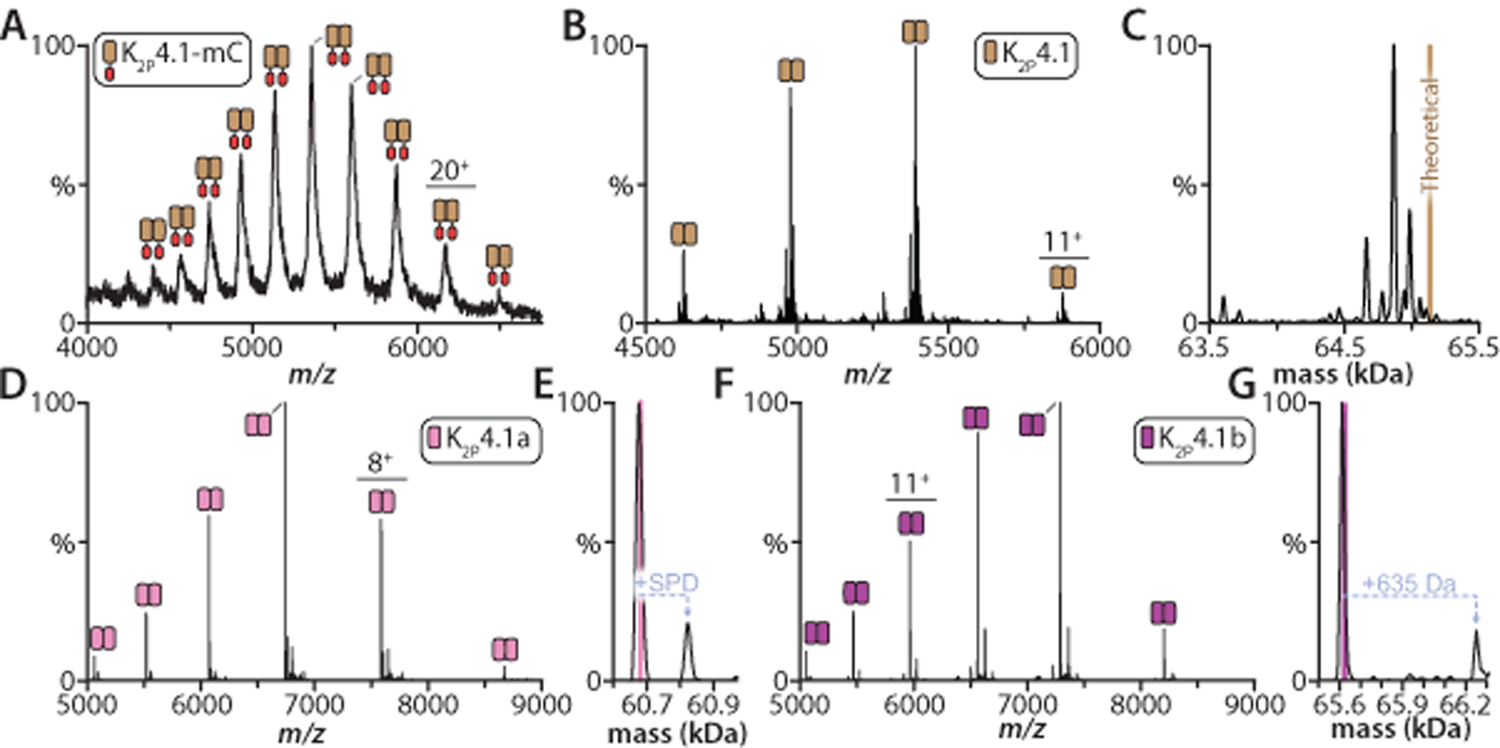
Figure 1. Optimization of human K2P4.1 isoforms for high-resolution native mass spectrometry studies.

A) Mass spectrum of K2P4.1 as a C-terminal fusion in decyl-β-D-maltopyranoside (DM) recorded under activating, non-native conditions on a Synapt G1 HDMS instrument (see methods). The TEV protease cleavable C-terminal fusion consists of mCherry (mC) followed by affinity tags. B) Mass spectrum of the K2P4.1 with C-terminal fusion protein removed by TEV protease treatment and purification in the pentaethylene glycol monodecyl ether (C10E5) detergent. Data recorded on the extended mass range (EMR) Orbitrap. C) Deconvolution of the mass spectrum shown in panel B. The theoretical mass of the dimer is denoted by a brown line. D) Mass spectrum of K2P4.1a expressed with fusions on the N- and C-terminus in C10E5 and 10 mM spermidine. The sample has been treated to remove fusion tags. E) Deconvolution of the mass spectrum shown in panel D. Pink line denotes the theoretical mass for the dimer (60,684 Da) and the measured mass is 60,678 ± 6 Da. F) K2P4.1b was expressed with affinity tags fused to both termini. Mass spectrum of K2P4.1b with tags removed and solubilized in C10E5 and 10 mM spermidine. G) Deconvolution of the K2P4.1b mass shown as described in C. The measured mass is 65,616 ± 10 Da compared to the theoretical mass of 65,622 Da Mass spectra for panels D and E were acquired on the Rear Entry Ion Source Orbitrap.39
