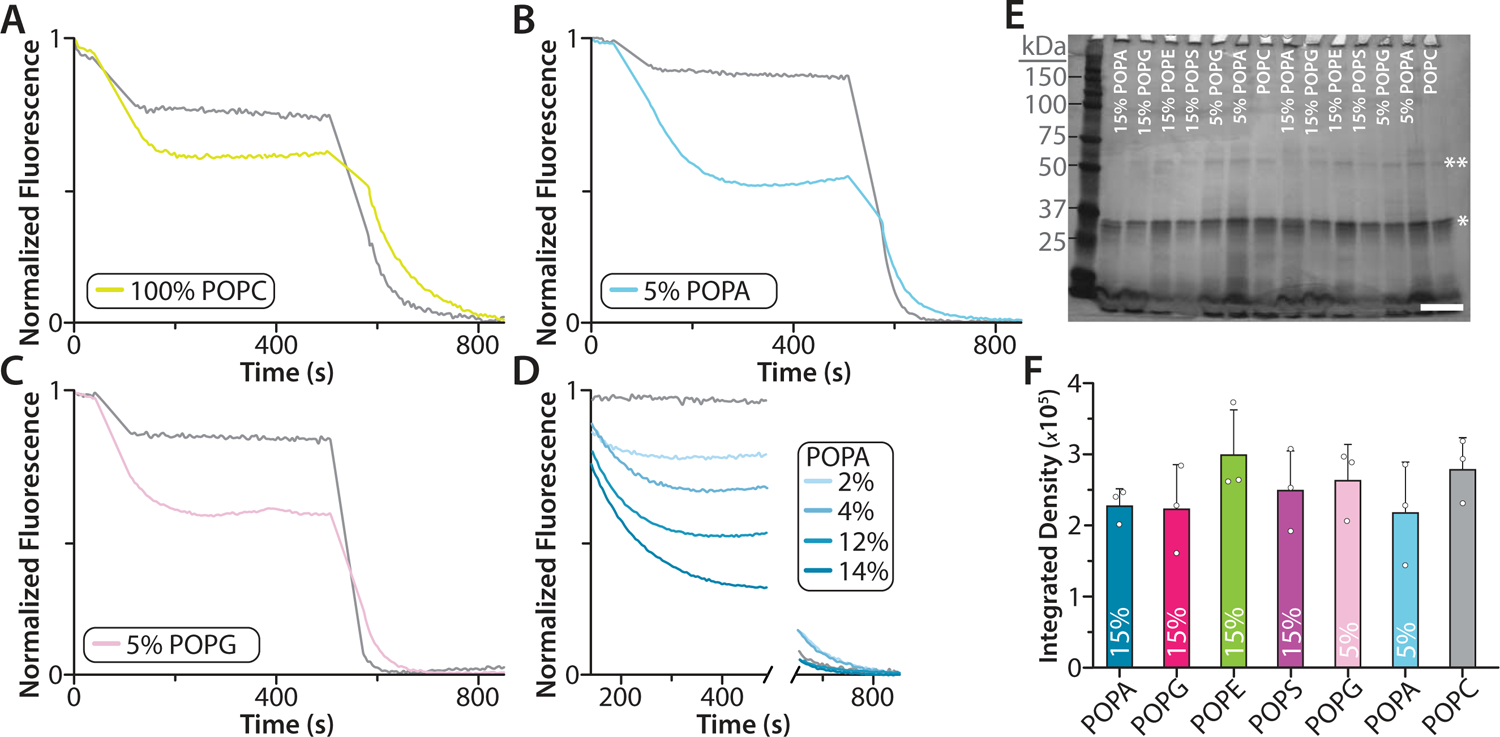
Extended Data Figure 7. Liposome potassium flux assays of K2P4.1a reconstituted in POPC.

A-D) Flux assay traces for K2P4.1a reconstituted in POPC and POPC doped with POPG or POPA. Empty liposomes of the same lipid composition are shown in grey. The mole fraction (%) of doped lipid is shown in the inset. E) Photograph of a silver stained SDS-PAGE of different proteoliposome mixtures used in the liposome potassium flux assays. Bands corresponding to monomer and dimer K2P4.1a are denoted by a single and double asterisk, respectively. The Precision Plus Protein Dual Color Standard (Bio-Rad) protein ladder was loaded in the first lane and molecular weight in kDa is shown to the left. The white scale bar (lower right corner) represents 1 cm. (F) Densitometry analysis of K2P4.1a monomeric bands. No statistical differences were found between the different samples. Shown are the mean and standard deviation (n = 3) for three independent experiments (white dots).
