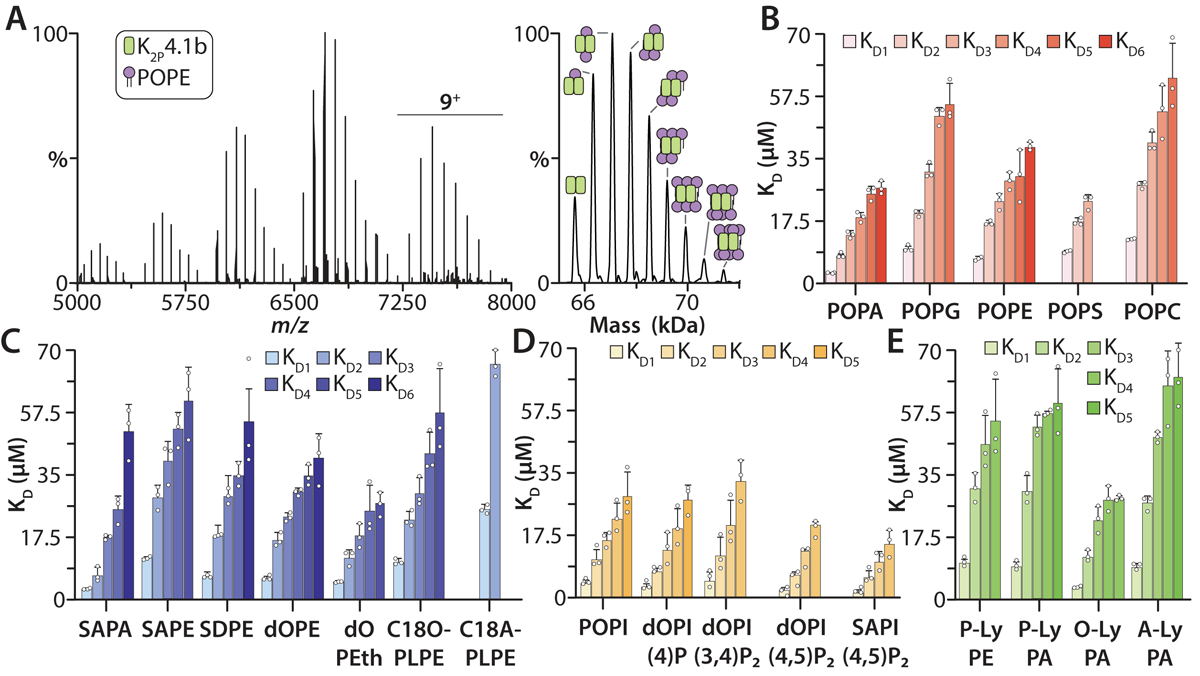
Figure 3. Biophysical characterization of individual lipid binding events to K2P4.1b.

A) Representative mass spectra of K2P4.1b with 20 μM POPE in C10E5 and 10 mM spermidine collected at room temperature. Deconvolution of the mass spectrum is shown to the right. B) Binding constants for PO-type lipids binding to K2P4.1b. C) KD values for K2P4.1b binding PA and PE with different acyl chains and PEth. The different linkage of PL lipids impacts their bind affinity to K2P4.1b. D) Binding constants for binding PI and PIPs to K2P4.1b. E) KD values for LyPE and LyPA lipids binding to K2P4.1b. Lipid abbreviations are listed in Supplementary Table 1. Data are presented as the mean ± standard deviation (n = 3) for three independent experiments (white dots).
