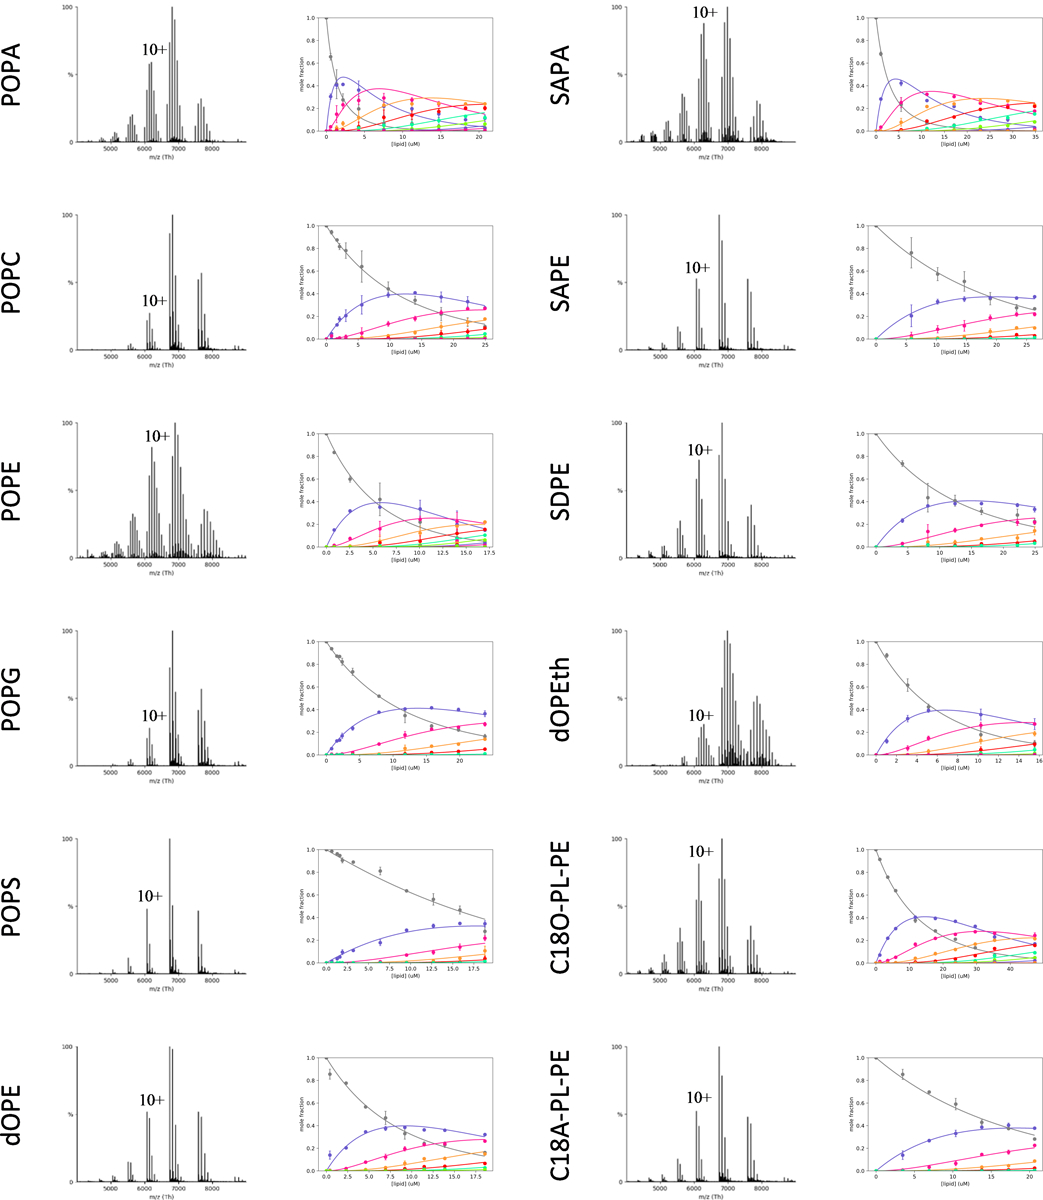
Extended Data Figure 3. Determination of equilibrium dissociation constants (KD) for lipids binding K2P4.1a.

Shown are representative native mass for K2P4.1a in the presence of 20 μM of lipid. Plots of mole fraction (right panel) for apo K2P4.1a and bound to different number of lipids determined from a titration series (dots with error bars to represent the three measurements) and resulting fit from a sequential lipid-binding model (solid lines). Lipid abbreviations are provided in Supplementary Data Table 1.
