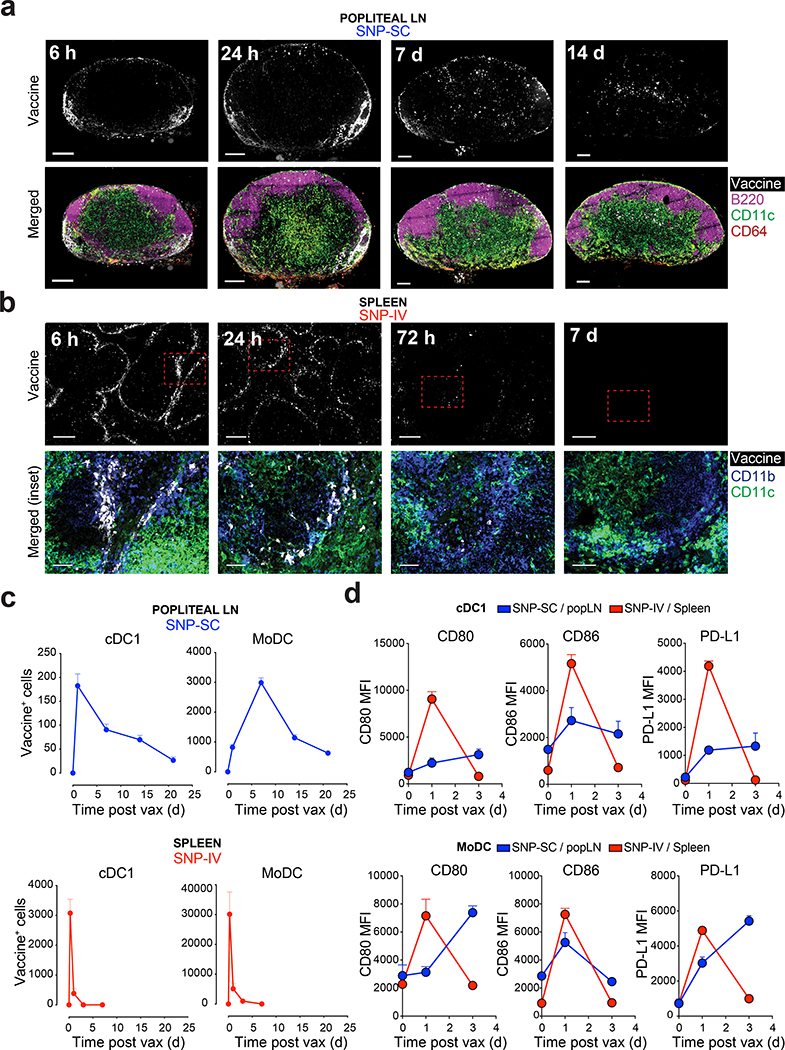
Figure 5 |. Transient vaccine distribution to spleen and activation of migratory cDC1 and moDC in after SNP-IV.
a, Mice (n = 3) were vaccinated with SNP-7/8a labeled with Alexa Fluor 647. Popliteal LNs and spleens were harvested from mice at specified time points. Confocal images of sections from popliteal LNs collected 0 h, 6 h, 24 h, 7 d and 14 d after SC injection with labeled SNP-7/8a. Left panel, vaccine; Right panel, merged. White, vaccine; magenta, B220 (B cells); green, CD11c (moDC or cDC); red, CD64 (monocytes or macrophages). Scale bars, 200 μm. b, Confocal images of sections from spleens collected 0 h, 6 h, 24 h, 3 d and 7 d after IV injection with labeled SNP-7/8a. Left panel, vaccine; Right panel, merged of inset. White, vaccine; blue, CD11b (monocytes, macrophages or cDC2), CD11c (moDC or cDC). Scale bars, 200 μm or 50 μm (inset). c, Popliteal LNs and spleens were harvested, and single cell suspensions were assessed by flow cytometry for detailed identification of DC subsets. Kinetics of vaccine+ cDC1 (XCR1+MHCII+CD11c+; top panels) and moDC (F4/80+CD64+MHCII+CD11c+; bottom panels) in popliteal LN (left panels) or spleen (right panels) after injection with labeled vaccines via SC or IV respectively (n = 3). d, Graphs summarize the mean fluorescence intensity (MFI) of CD80 (left panel), CD86 (middle panel) and PD-L1 (right panel) expressed on cDC1 and moDC in popliteal LN after SNP-SC (blue lines) or in spleen after SNP-IV (red lines) (n = 3). Mean ± s.e.m. (c,d). Data are representative of two independent experiments.

