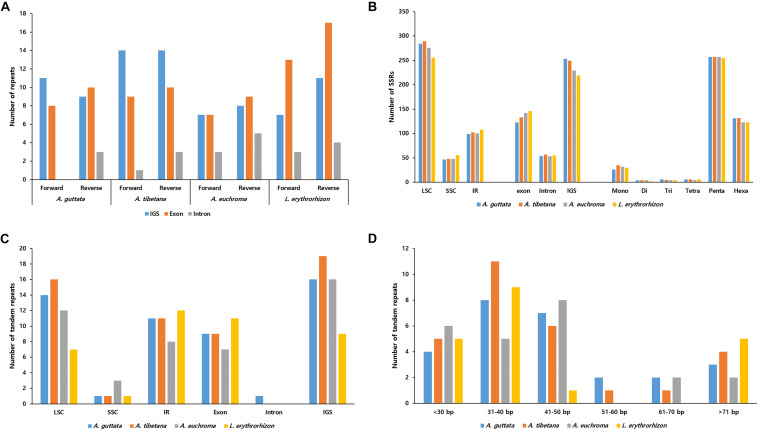
FIGURE 5.
Distribution of repeat sequences in Arnebia and Lithospermum chloroplast genomes. (A) Number of forward and reverse repeats in genomic regions. (B) Distribution of SSRs in intergenic spacer (IGS), exon, and intron regions. (C) Distribution of tandem repeats in genomic regions. (D) Distribution of tandem repeats’ length.

