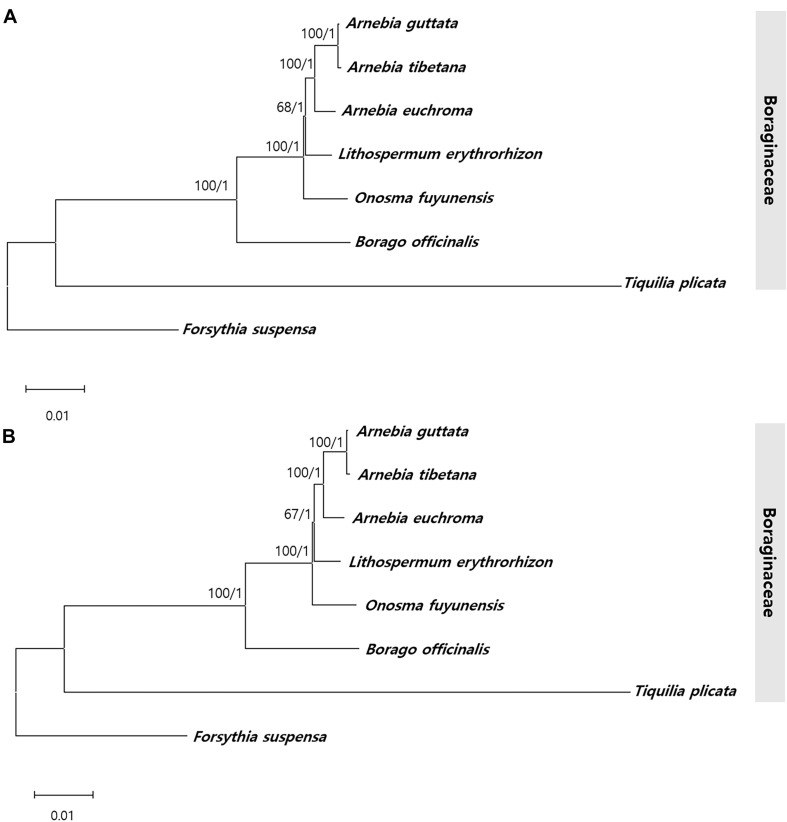
FIGURE 9.
Phylogenetic tree from Arnebia and Lithospermum using maximum likelihood bootstraps and Bayesian posterior probabilities. (A) Whole chloroplast genome dataset topology, (B) 72 CDS dataset topology. Maximum likelihood topology is shown with bootstrap support values/Bayesian posterior probabilities given at each node.

