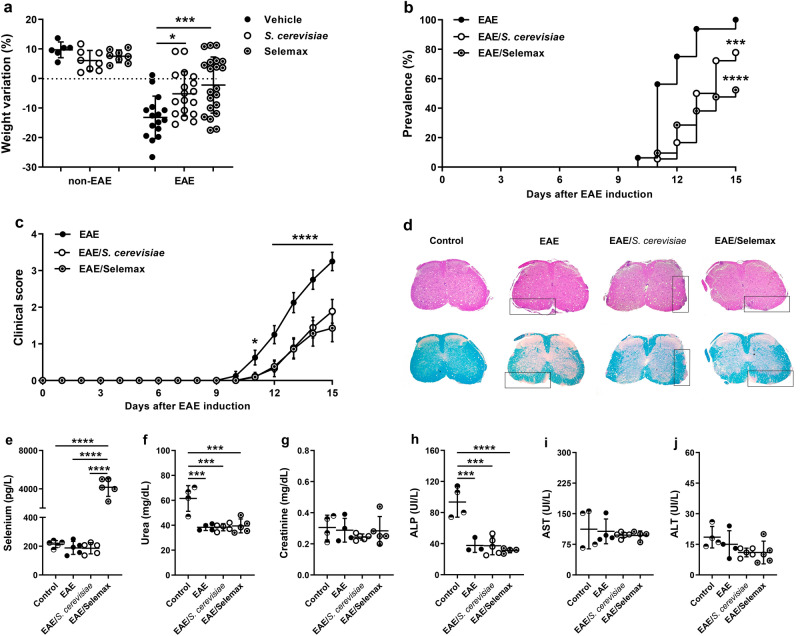
Figure 2.
Effect of S. cerevisiae and Selemax on EAE development. EAE and non-EAE mice received 14 oral doses of S. cerevisiae or Selemax every day. The percentage of weight variation was calculated based on the initial and last animal´s body weight (a). Disease prevalence (b) and clinical score (c) were assessed daily for 15 days. Four independent experiments were combined, n = 6–8 in non-EAE groups and n = 16–21 mice in EAE groups. Inflammatory infiltration and demyelination were evaluated in hematoxylin/eosin (upper) and luxol fast blue (bottom) stained sections, respectively, obtained from control (non-EAE and non-supplemented mice), EAE, EAE/S. cerevisiae and EAE/Selemax groups (d). Biochemical parameters as total selenium (e), urea (f), creatinine (g), alkaline phosphatase (ALK) (h), aspartate aminotransferase (AST) (i) and alanine aminotransferase (ALT) (j) were analyzed in serum samples. Two independent experiments were combined, n = 4–5 mice/group. Statistical analysis was performed by one-way ANOVA and subsequent Tukey’s test (a, e) or Holm-Sidak´s test (f–j), Log-rank (Mantel–Cox) test (b) and two-way ANOVA and subsequent Tukey’s test (c). All data were expressed as the mean ± SD and statistical differences were represented by *p < 0.05, ***p < 0.001 and ****p < 0.0001. The graphs were created using GraphPad Prism v.8.0.2 and image was modified with Adobe Photoshop v.22.0.0.

