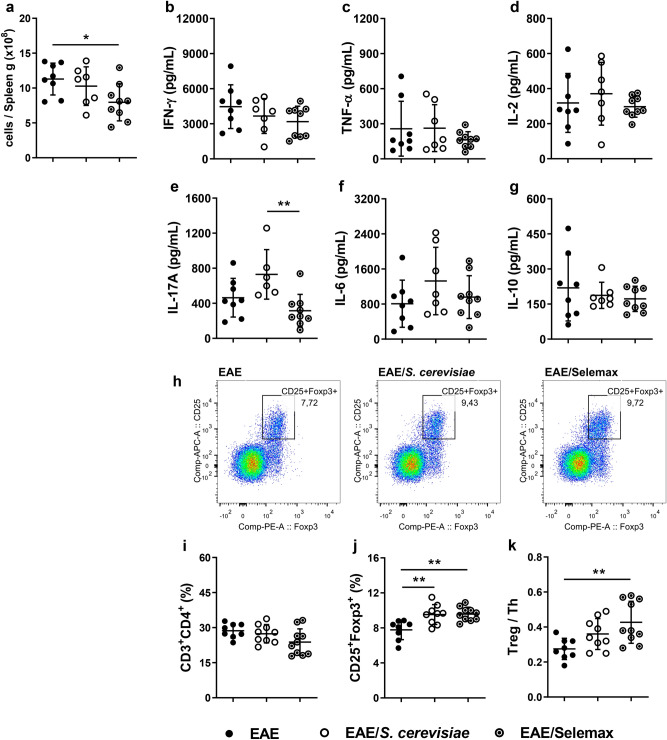
Figure 4.
Effect of S. cerevisiae and Selemax on cytokine production by spleen and proportion of Tregs in inguinal lymph nodes. EAE mice received 14 oral doses of S. cerevisiae or Selemax. Total number of leukocytes from spleen adjusted per gram of tissue (a). Spleen cells (5 × 10⁶) were stimulated with MOG35-55 (20 µg/mL) for 48 h and the production of IFN-γ (b), TNF-α (c), IL-2 (d), IL-17A (e), IL-6 (f) and IL-10 (g) were assessed in the supernatants. Representative gating strategy to assess regulatory T cells (Treg - CD25+Foxp3+) in inguinal lymph nodes (h). Total cells from inguinal lymph nodes were collected and analyzed by flow cytometry to determine the proportion of T helper cells (Th - CD3+CD4+) (i) and Treg in total Th cells (j). The proportion of T subsets was used to calculate the ratio between Treg and Th cells (k). Statistical analysis was performed by one-way ANOVA and subsequent Tukey’s test. All data were expressed as the mean ± SD and statistical differences were represented by *p < 0.05 and **p < 0.01. Two independent experiments were combined, n = 7–10 mice/group. The graphs were created using GraphPad Prism v.8.0.2, flow cytometry images were created using FlowJo 10.7.1 and image was modified with Adobe Photoshop v.22.0.0.

