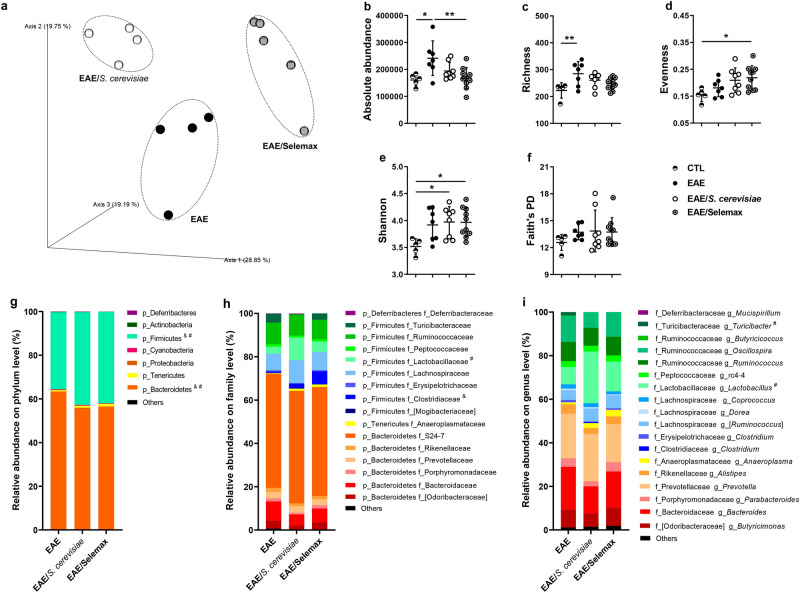
Figure 6.
Effect of S. cerevisiae and Selemax on microbiota composition. EAE mice received 14 oral doses of S. cerevisiae or Selemax. Principal Coordinates Analysis (PCoA) of unweighted UniFrac distances of 16 S rRNA genes (a). Absolute abundance (b), richness (c), evenness (d), Shannon diversity index (e) and Faith’s phylogenetic index (f) of fecal bacterial OTUs. Relative abundance at phylum (g), family (h) and genus (i) level. Statistical analysis was performed by one-way ANOVA and subsequent Tukey’s test (b–f) and two-way ANOVA and subsequent Tukey’s test (g–i). All data were expressed as the mean ± SD and statistical differences were represented by *p < 0.05 and **p < 0.01; # p < 0.05 between EAE and EAE/S. cerevisiae; &p < 0.05 between EAE and EAE/Selemax. One experiment representative of two independent experiments (a) and two independent experiments were combined (b–i), n = 4–9 mice/group. PCoA was created using QIIME2 v.2020.2 (https://view.qiime2.org/), the graphs were created using GraphPad Prism v.8.0.2 and image was modified with Adobe Photoshop v.22.0.0.

