Figure 2.
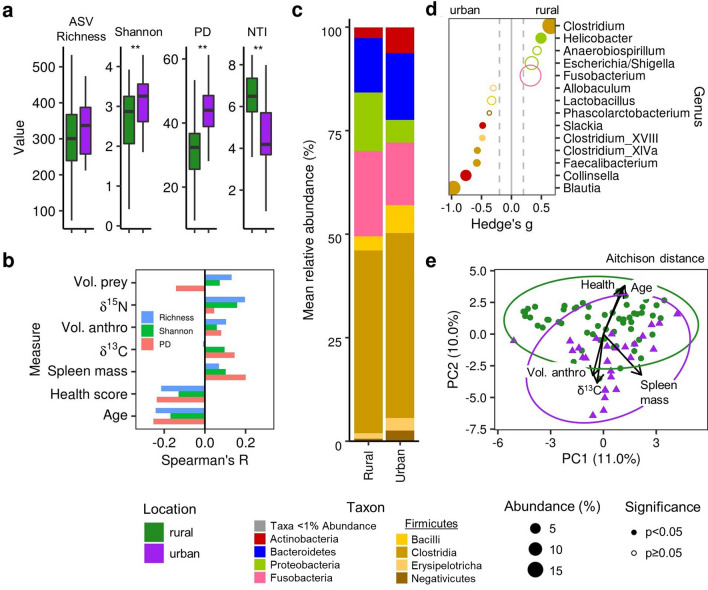
Coyote fecal microbiome alpha-diversity, composition, and structure. (a) Differences in measures of ASV richness, Shannon diversity, Faith’s phylogenetic diversity (PD), and the nearest taxon index (NTI) between the fecal microbiome of urban and rural coyotes. Significant differences (p < 0.01) are indicated by asterisks. (b) Spearman correlation coefficients between richness, diversity, and PD and measures of coyote diet and body condition. (c) Average relative abundance of each taxon in urban and rural coyotes. Taxa with a mean relative abundance of < 1% are categorized as ‘other.’ Firmicutes (yellow shades) are separated to the class level; all other taxa appear at the phylum level. (d) Differentially abundant bacterial families between urban and rural coyotes, ranked by the effect-size difference between groups measured using Hedge’s g. Circle size indicates taxon relative abundance, and solid circles indicate significantly differentially abundant taxa (Benjamini–Hochberg adjusted p < 0.05). (e) Principal components analysis using the Aitchison distance, which is based on centered log-ratio transformed ASV abundances. Vectors indicate significant (p < 0.05) relationships with diet and health measures.

