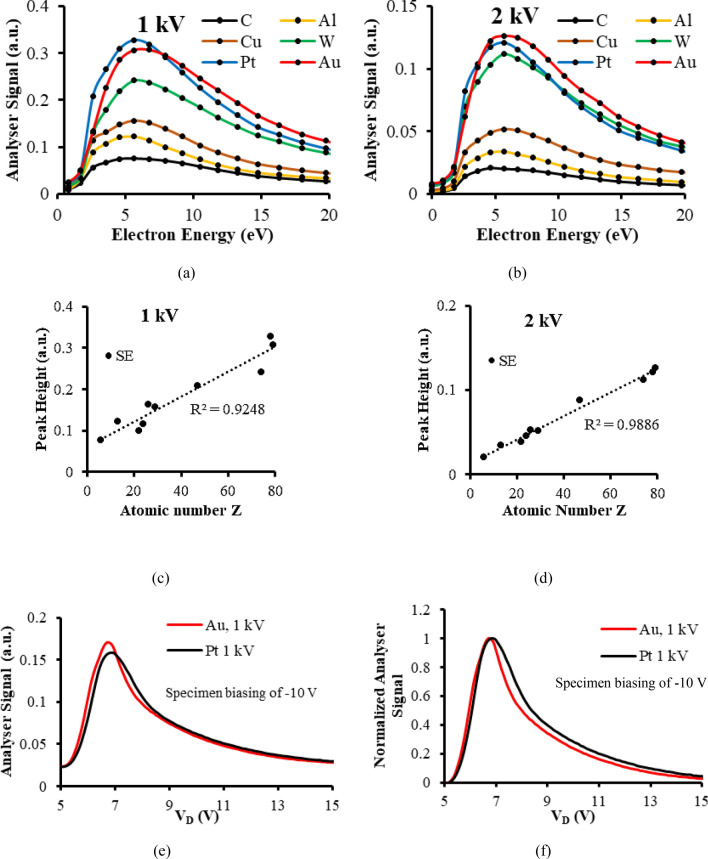
Figure 1.
Quantitative material contrast extracted from energy analyser spectral signals (a) Experimental energy analyser spectra at a primary beam voltage of 1 kV for 6 different metals with 0 V specimen bias (b) Experimental energy analyser spectra at a primary beam voltage of 2 kV for 6 different metals with 0 V specimen bias (c) Spectral peak height variation with atomic number at a primary beam voltage of 1 kV (d) Spectral peak height variation with atomic number at a primary beam voltage of 2 kV (e) Experimental energy analyser spectra at a primary beam voltage of 1 kV for Pt and Au metal foil specimens with a − 10 V specimen bias (f) The normalised experimental energy analyser spectra shown in (e).

