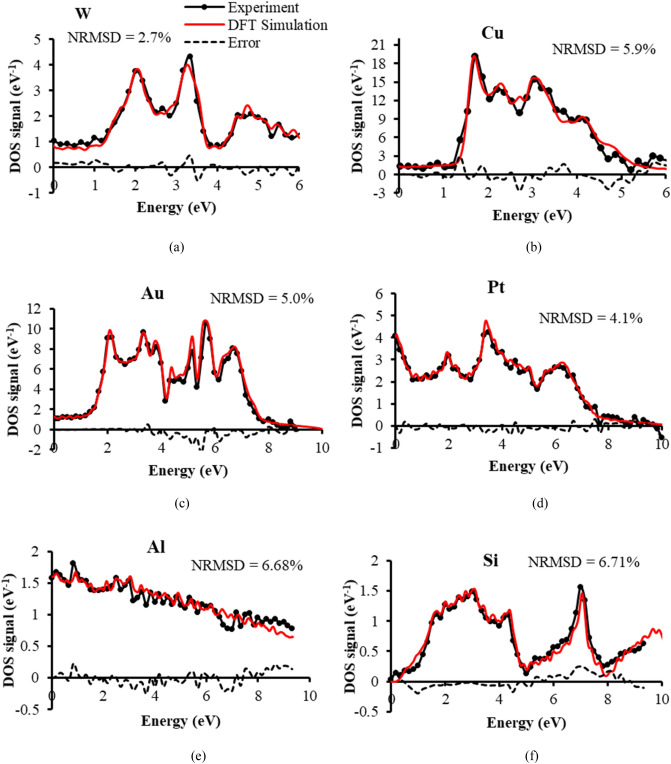
Figure 4.
Comparison of SE spectral experimental DOS signals with theoretical DFT distributions and their error signals for 6 test specimens. The independent variable (“Energy”) is labelled as defined by DFT distributions, but experimentally corresponds to SE energy. The experimental SE spectral DOS signal is obtained by numerically differentiating the difference signals shown in Fig. 3. The NRSMD (normalised root mean square difference) values of the error signals are normalised to the experimental DOS signal peak value: (a) W (b) Cu (c) Au (d) Pt (e) Al (f) intrinsic Si.

