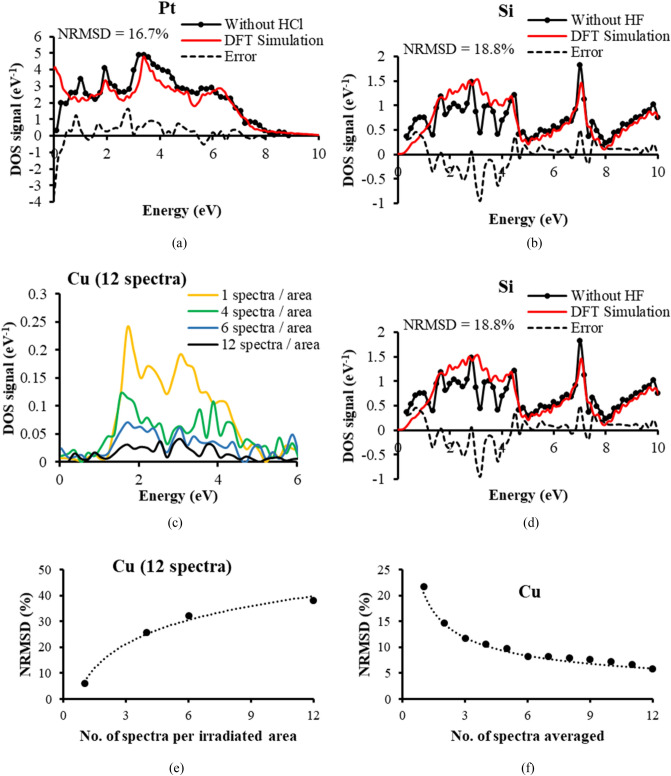
Figure 5.
Effects of acid pre-cleaning, contamination, and spectral signal averaging on the accuracy of the experimental SE spectral DOS signals (a) Pt specimen without HCL pre-cleaning (b) Intrinsic Si without HF pre-cleaning (c) Variation in contamination on Cu by altering the number of irradiated areas for fixed number of 12 spectra (d) Match to theoretical DFT distribution on Cu for 12 spectra all from one irradiated area (e) NRMSD variation with number of spectra per irradiated area on Cu for 12 spectra. Dotted fitted curve takes the form, (f) NRMSD variation with the number of spectra averaged, dotted fitted curve takes the form:

