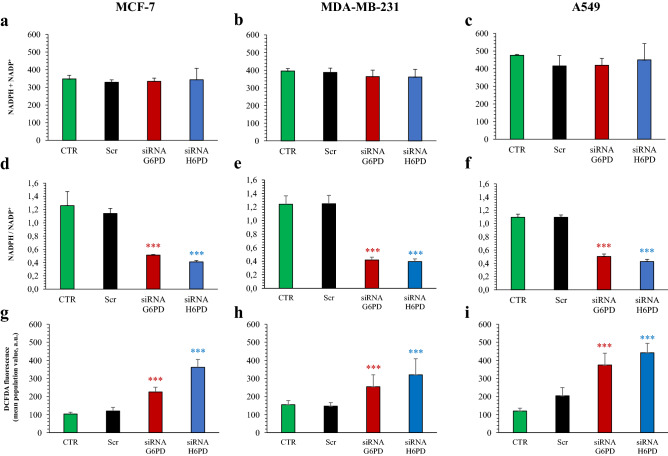
Figure 5.
Effect of G6PD and H6PD silencing on cell redox status. Total NADPH + NADP content was similar in MCF-7 (a), MDA-MB-231 (b) and A549 (c) under control condition (CTR, green), scramble siRNA (Scr, black), siRNA G6PD (red) and siRNA H6PD (blue). By contrast, NAPDH/NADP+ ratio was significantly decreased by either G6PD or H6PD silencing in all three cell lines (d–f). This response was paralleled by an opposite behavior of ROS cell content that was instead significantly increased by both gene silencing (g–i). Data are expressed as mean ± SD. ***p < 0.001 vs corresponding scramble.

