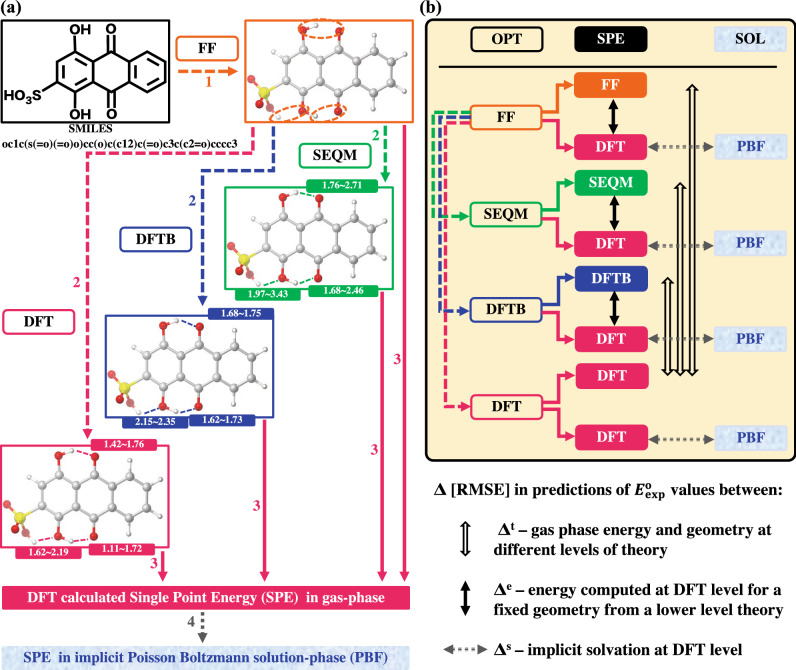
Figure 1.
(a) Schematic showing the chain of operations for geometry optimization (OPT) and single point energy (SPE) calculations at different levels of theory (b) A graphical summary of the various levels of approximations used to estimate . The hollow black arrows with symbol Δt represent the difference between gas-phase reaction energies of the optimized geometries obtained at different levels of theory. The solid black arrows with symbol Δe represent the difference between energies computed using DFT on a fixed geometry obtained from a lower-level theory and energies computed at that given level of theory. The dotted gray arrows represent the solvation effect from gas-phase SPE to solution-phase SPE, when the implicit solvation model is considered. For both (a,b), the text boxes with no background color represent geometry optimizations; the boxes with colored background represent SPE calculations; the boxes with water bubbles in the background represent solution-phase SPE calculations using the implicit aqueous solvent model.

