Figure 2.
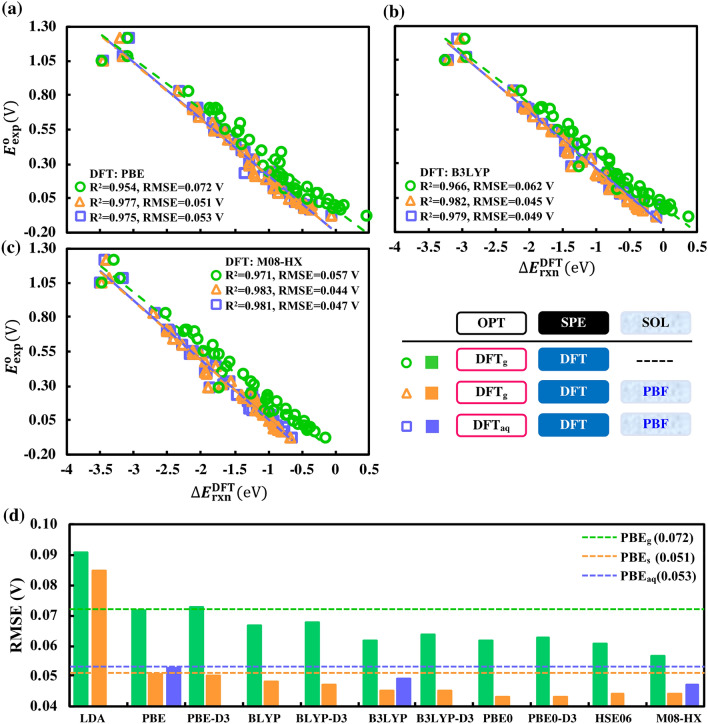
Performance comparisons of different exchange–correlation functionals in predicting the experimentally measured redox potentials, . The scatter plots (a–c) show linear correlations of the DFT calculated energy difference, , versus , for the three representative functionals of (a) PBE, (b) B3LYP, and (c) M08-HX. The bar plot (d) shows the RMSE for all the functionals considered. The color green represents both OPT and SPE in gas-phase, the color orange represents OPT in gas-phase followed by SPE with SOL, and the color blue represents both OPT and SPE with SOL, as also summarized in a tabular format. In (d), the horizontal dashed green line represents PBEg (RMSE = 0.072 V, R2 = 0.954) benchmark, the horizontal dashed blue line represents PBEaq (RMSE = 0.053 V, R2 = 0.975) benchmark, and the horizontal dashed orange line represents PBEs (RMSE = 0.051 V, R2 = 0.977) benchmark.

