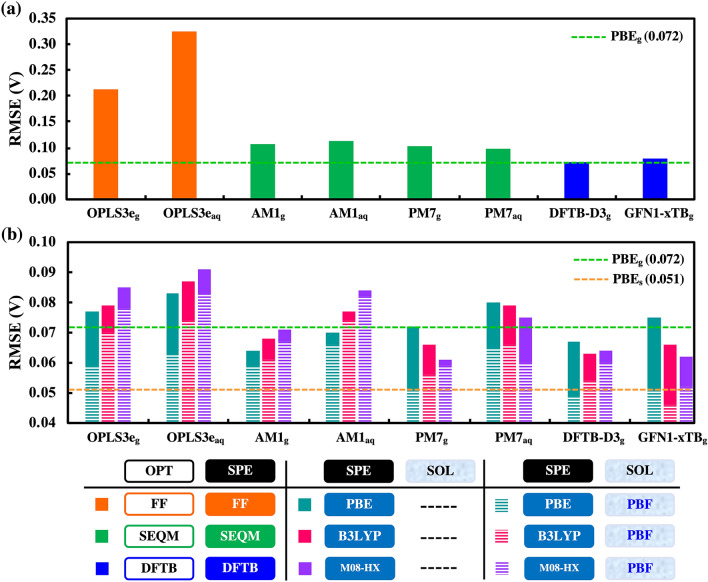
Figure 3.
Performance comparisons of low-level methods: FF, SEQM and DFTB. (a) RMSE of SPE data calculated at the three different levels of theory. Similarly, (b) RMSE of DFT calculated SPE data on the geometries obtained from the three different levels of theory. In (b), the solid bars show SPE results without implicit solvation effects, whereas the dashed bars show results with implicit solvation effects taken into account. The dashed green horizontal line represents PBEg (R2 = 0.954, RMSE = 0.072 V) benchmark and the dashed orange horizontal line represents PBEs (R2 = 0.977, RMSE = 0.051 V) benchmark.

