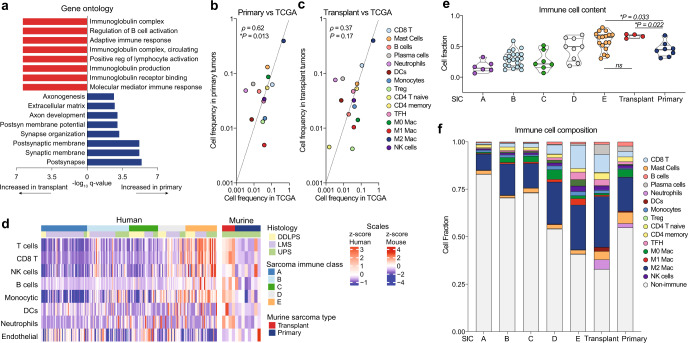
Fig. 4. Transcriptional signatures in mouse and human sarcomas.
a Gene ontology analysis of differentially regulated processes in primary (blue) versus transplant (red) sarcomas after isotype treatment. b Spearman correlation analysis of bulk tumor RNA from primary tumors (n = 8) and untreated human UPS (TCGA, n = 87). c Spearman correlation of bulk tumor RNA from transplant tumors (n = 4) and untreated human UPS (TCGA, n = 87). d Cellular composition of TCGA sarcomas (DDLPS, dedifferentiated liposarcoma; LMS, leiomyosarcoma; UPS, undifferentiated pleomorphic sarcoma) (n = 218) separated by previously defined sarcoma immune class (SIC, left) and murine primary sarcomas (right). Sample sizes: SIC A (n = 57), SIC B (n = 52), SIC C (n = 36), SIC D (n = 34), SIC E (n = 39), primary (n = 8), and transplant (n = 4). e Immune cell content of TCGA sarcomas by sarcoma immune class (SIC) and murine sarcomas. Sample sizes: SIC A (n = 6), SIC B (n = 21), SIC C (n = 7), SIC D (n = 9), SIC E (n = 17), primary (n = 8), and transplant (n = 4). Significance determined by two-sided Wilcoxon test. f Immune cell composition of TCGA sarcomas by sarcoma immune class (SIC) and murine sarcomas. In b–f, cell proportions enumerated by CIBERSORTx. Source data are provided as a Source data file.

