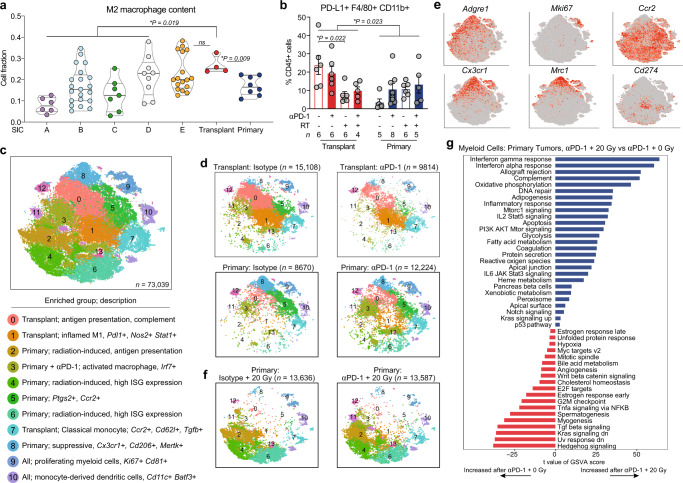
Fig. 5. Tumor and treatment promote myeloid cell remodeling.
a M2 macrophage content of TCGA UPS (by SIC) and murine sarcomas by CIBERSORTx. P values shown for SIC A-D, E, and primary tumors each vs transplant tumors by two-sided Wilcoxon test. Sample sizes as follows: SIC A (n = 6), SIC B (n = 21), SIC C (n = 7), SIC D (n = 9), SIC E (n = 17), primary (n = 8), and transplant (n = 4). b Frequency of PD-L1+ macrophages by CyTOF. Data show mean ± SEM, analyzed by three-way ANOVA. c tSNE plot of myeloid cell scRNA-seq subclustering from all tumor and treatment groups. For major clusters, legend lists tumor/treatment group(s) where each cluster is enriched and description. ISG, interferon-stimulated gene. d Distribution of myeloid cells, separated by tumor and treatment type. n = 4 tumors per group for transplant, n = 5 tumors per group for primary. e Expression levels of marker genes. f Distribution of myeloid cells from primary tumors treated with 20 Gy RT and isotype (left) or αPD-1 (n = 5 per group). g Pathways with significantly different activities per cell using GSVA between myeloid cells from primary tumors treated with αPD-1 and 20 Gy vs αPD-1 and 0 Gy (n = 25,811 cells analyzed). Pathways shown are significant at false-discovery rate <0.01. Source data are provided as a Source data file.

