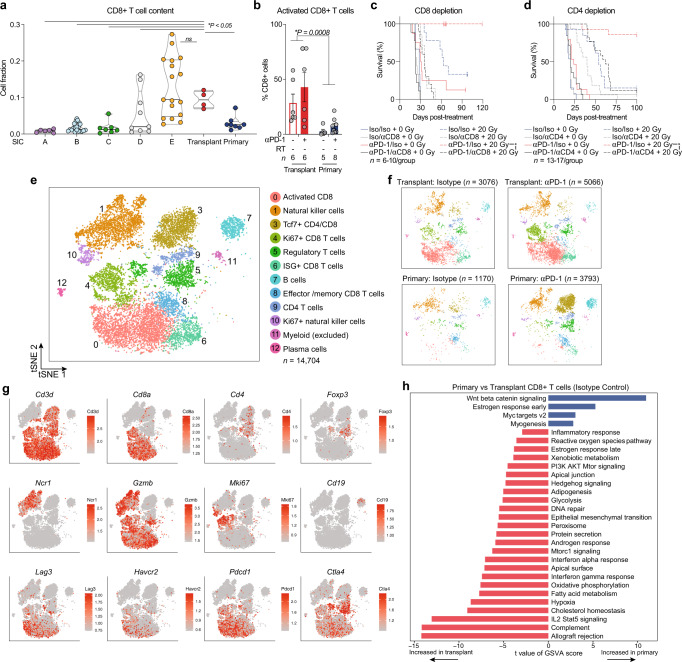
Fig. 6. Tumor and treatment promote lymphoid cell remodeling.
a CD8+ T cell content of TCGA UPS by sarcoma immune class (SIC) and murine sarcomas by CIBERSORTx. P values shown for each group vs transplant tumors by two-sided Wilcoxon test. Sample sizes as follows: SIC A (n = 6), SIC B (n = 21), SIC C (n = 7), SIC D (n = 9), SIC E (n = 17), primary (n = 8), and transplant (n = 4). b Frequency of activated (Lag3+ Tim3+) CD8+ T cells by CyTOF. Data show mean ± SEM by two-way ANOVA. c Mice with transplant sarcomas received either αPD-1 or isotype control antibodies, αCD8 or isotype control, and 0 Gy (solid) or 20 Gy (dashed) when tumors reached >70 mm3. Surviving mice were censored 164 days after treatment (*P = 0.002). Sample sizes: Iso/Iso + 0 Gy n = 6, Iso/αCD8 + 0 Gy n = 9, αPD-1/Iso + 0 Gy n = 8, αPD-1/αCD8 + 0 Gy n = 9, Iso/Iso + 20 Gy n = 9, Iso/αCD8 + 20 Gy n = 7, αPD-1/Iso + 20 Gy n = 7, αPD-1/αCD8 + 20 Gy n = 10. d Mice with transplant sarcomas received either αPD-1 or isotype control antibodies, αCD4 or isotype control, and 0 Gy (solid) or 20 Gy (dashed) when tumors reached >70 mm3. Surviving mice were censored 100 days after treatment (*P = 0.002). Sample sizes: Iso/Iso + 0 Gy n = 13, Iso/αCD4 + 0 Gy n = 15, αPD-1/Iso + 0 Gy n = 15, αPD-1/αCD4 + 0 Gy n = 14, Iso/Iso + 20 Gy n = 13, Iso/αCD4 + 20 Gy n = 16, αPD-1/Iso + 20 Gy n = 14, αPD-1/αCD4 + 20 Gy n = 17. e tSNE plot of lymphoid cell scRNA-seq subclustering from all tumor and treatment groups. f Distribution of lymphoid cells, separated by tumor and treatment type. n = 4 tumors per group for transplant, n = 5 tumors per group for primary. g Expression levels of marker genes. h Pathways with significantly different activities per cell using GSVA between CD8+ T cells from untreated (isotype control) primary tumors versus transplant tumors (n = 2473 cells analyzed). Pathways shown are significant at false-discovery rate <0.01. For c and d, survival curves estimated using Kaplan–Meier method; pairwise significance determined by log-rank test and Bonferroni correction. Source data are provided as a Source data file.

