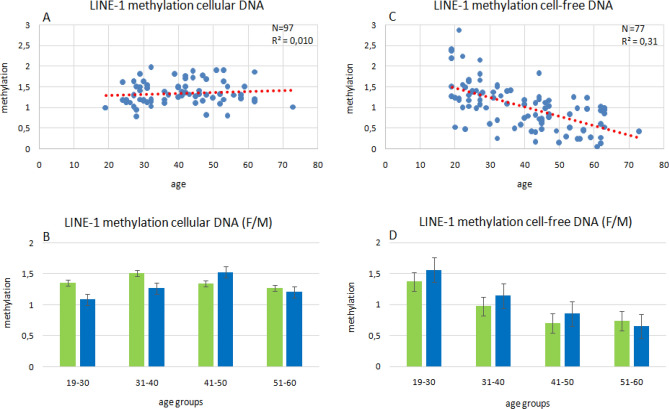
Figure 1.
Relative quantification of age-dependent LINE-1 methylation by IDLN-MSP in cellular and cfDNA. Correlation between age and DNA methylation of LINE-1 promoter region in cellular DNA (A, B) and cell-free DNA (C, D) derived from blood plasma of the indicated numbers of donors (N). The regression lines are colored in red and represent Pearson’s correlation coefficients (R2). Mean values of global DNA methylation at LINE-1 retrotransposons in cellular DNA and cell-free DNA from blood plasma by age subgroups (B, D). Mean values were compared by two-sample Student’s t-test with a significance threshold p < 0.05. 19–30 to 31–40 years, p = 0.01, 19–30 to 41–50 years, p = 0.0000043026, 19–30 to 51–60 years, p = 0.0000000049, 31–40 to 41–50 years, p = 0.1897896039, 31–40 to 51–60 years, p = 0.0040846031, 1D).

