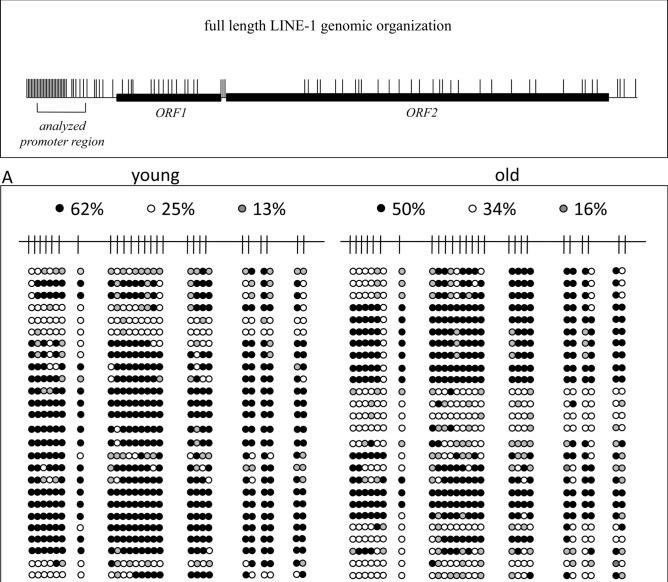
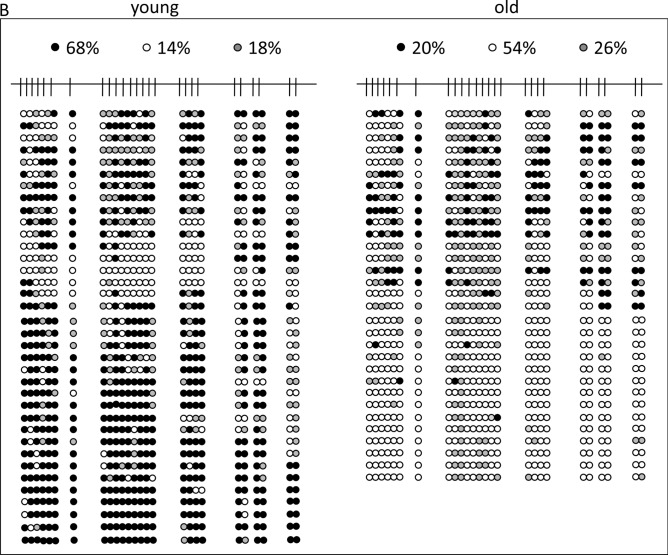
Figure 3.
Detailed analysis of LINE-1 promoter CpG-methylation derived from peripheral blood cellular DNA (A) and cell-free DNA (B) of 8 young individuals aged 21–29 years (left panels) and 8 elder individuals aged 50–58 years (right panels). On top, a schematic representation of a full-length LINE-1 retroelement is given showing the distribution of CpG dinucleotides (short vertical lines) and the open reading frames 1 and 2 (ORF1/2). The analyzed 436 bp region of interest is indicated by square brackets. Detailed CpG-methylation profiles of this region revealed by bisulfite genomic sequencing are shown in panels A and B. Filled circles stand for methylated CpG dinucleotides. White circles stand for unmethylated CpGs. Grey circles stand for an undefined CpG methylation status. In the panel C the result is illustrated in bar diagrams in order to visualize the most differentially methylated CpG positions. Each bar shows the frequency of methylated CpGs at the position indicated. Positions are relative to the ATG start codon of LINE-1 ORF1. An asterisk indicates the positions of the primers used for the MS-PCR shown in Fig. 1. The left diagram shows the analyses from peripheral blood cellular DNA of young (green) and elder (blue) individuals. The right diagram shows the analyses from peripheral blood cfDNA of young (green) and elder (blue) individuals.


