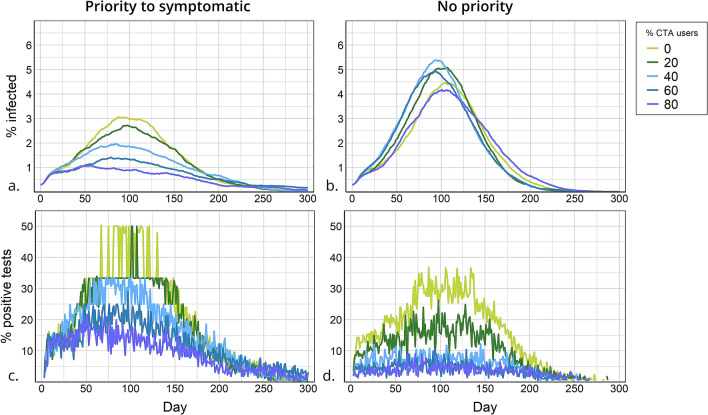
Figure 6.
Infection prevalence and positive tests for a testing policy with and without priority to symptomatic cases. Percentage infected (a) and percentage of positive tests (c) by day, for a testing policy with priority to symptomatic. Percentage infected (b) and percentage positive tests (d) by day, for a testing policy without priority. Percentage of CTA users in the scenario is marked by line colour. In these scenarios: testing capacity = 1.5% and CTA compliance is high. Note that in the scenarios with no CTA users, although only symptomatic cases are tested, the percentage of positive tests is not 100% because of cases with influenza-like illness that are also being tested.

