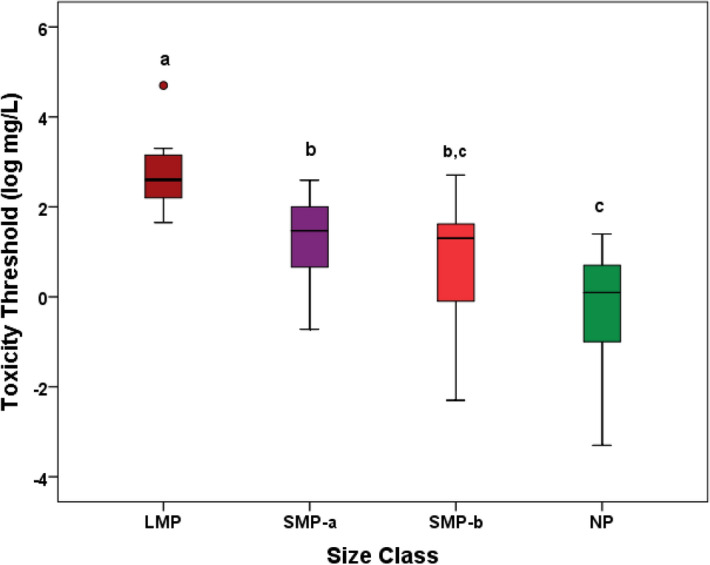
Figure 2.

Toxicity thresholds of plastic particles on aquatic organisms. Note the reduction in toxicity threshold, i.e. the increase in toxicity, as particle size decreases. Size classes were defined as: large microplastics (LMP, > 100 µm), small microplastics between > 10 and 100 µm (SMP-a), small microplastics between 1 and 10 µm (SMP-b), and nanoplastics (NP, < 1 µm). Horizontal line: median; box boundaries: 25th and 75th percentiles; bars: range of observed values. LMP shows a potential outlier. Different letters indicate significantly different groups (Tukey, p < 0.05).
