Figure 2.
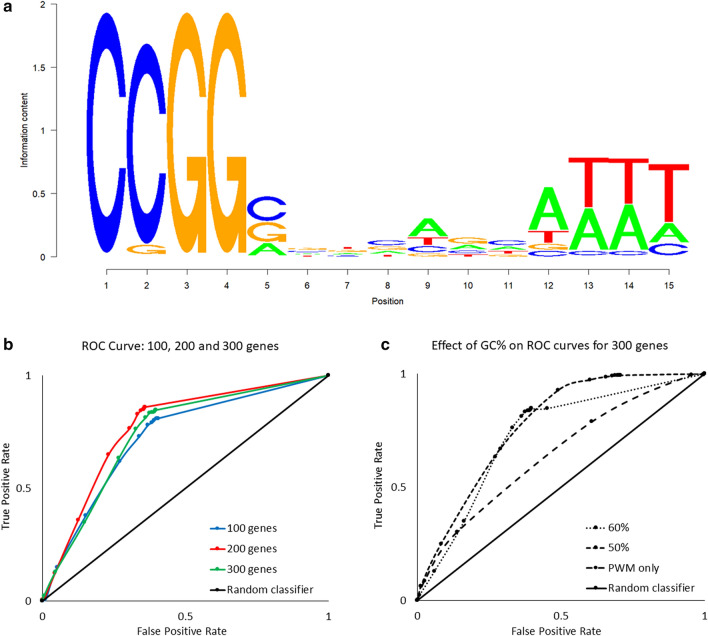
Construction of MeCP2 position weight matrix (PWM) threshold and GC%: Matrix-GC Procedure using MeCP2 ChIP-Seq data on IMR-90 cells. (a) Sequence logo for the conservation sequence for MeCP2. (b) ROC curves for 100, 200 and 300 genes establishing a preferential PWM score threshold. The area under the curve (AUC) is 0.725, 0.7685, 0.7419, for 100, 200 and 300 genes respectively. (c) ROC curves for 300 genes evaluating the effects of DNA sequence GC content percentage. The AUC values are 0.7301, 0.7692 and 0.6351 for GC content percentages of 50%, 60%, and PWM only, respectively. The random classifier is represented by x = y and has an AUC of 0.50.

