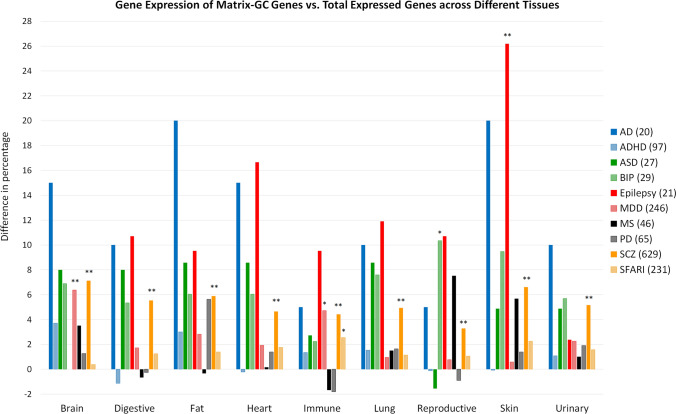
Figure 3.
Genes associated to each disorder and tissue (horizontal axis) have a different RNA expression distribution (vertical, in percent) before and after Matrix-GC. Distribution of RNA expression, by tissue, for genes associated to brain disorders before and after Matrix-GC. The vertical axis reports the difference between the percentage of genes expressed in the different systems before and after Matrix-GC. Disorders included are Autism database (SFARI, Yellow), schizophrenia (SCZ, Orange), Parkinson’s disease (PD, Grey), multiple sclerosis (MS, Black), major depressive disorder (MDD, Pink), epilepsy (Red), autism (ASD, Dark Green), Alzheimer’s disease (AD, Blue), attention deficit hyperactivity disorder (ADHD, Light Blue) and bipolar disorder (BIP, Light Green). For immune, digestive, urinary and reproductive systems we considered data from different organs. Immune tissues include data from: lymph node, bone marrow, spleen, adrenal, thyroid and appendix data. Digestive includes data from: colon, duodenum, oesophagus, gall bladder, pancreas, liver, small intestine, salivary gland and stomach data. Reproductive tissues include data from: ovary, testis, endometrium, prostate and placenta. Urinary System urinary bladder and kidney data. Numbers in parentheses represent the total number of genes for which expression data was retrieved. The Fisher’s exact test was used for statistical calculations. *represents p value ≤ 0.05 and ** represents p value ≤ 0.01.

