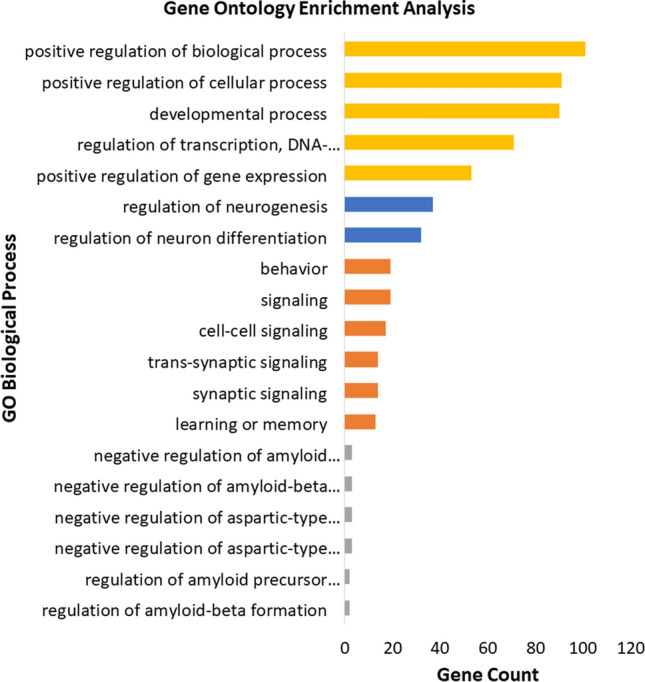
Figure 4.

Gene Ontology enrichment analysis of neuropsychiatric and neurological disorders using GOrilla Enrichment. Bar plot of the 5 most significant results from Gene Ontology enrichment analysis of each neuropsychiatric and neurological datasets after the Matrix-GC. The following disorders are represented: attention deficit hyperactivity disorder (ADHD, Orange), schizophrenia (SCZ, Blue), Alzheimer’s disease (AD, Grey), Autism database (ASD-SFARI, Yellow). Full statistical results from GOrilla Enrichment can be found in the Supplementary Information files. Control permutation analysis was carried out on randomly generated and size-matched, from hg19 human reference genome and exome subset.
