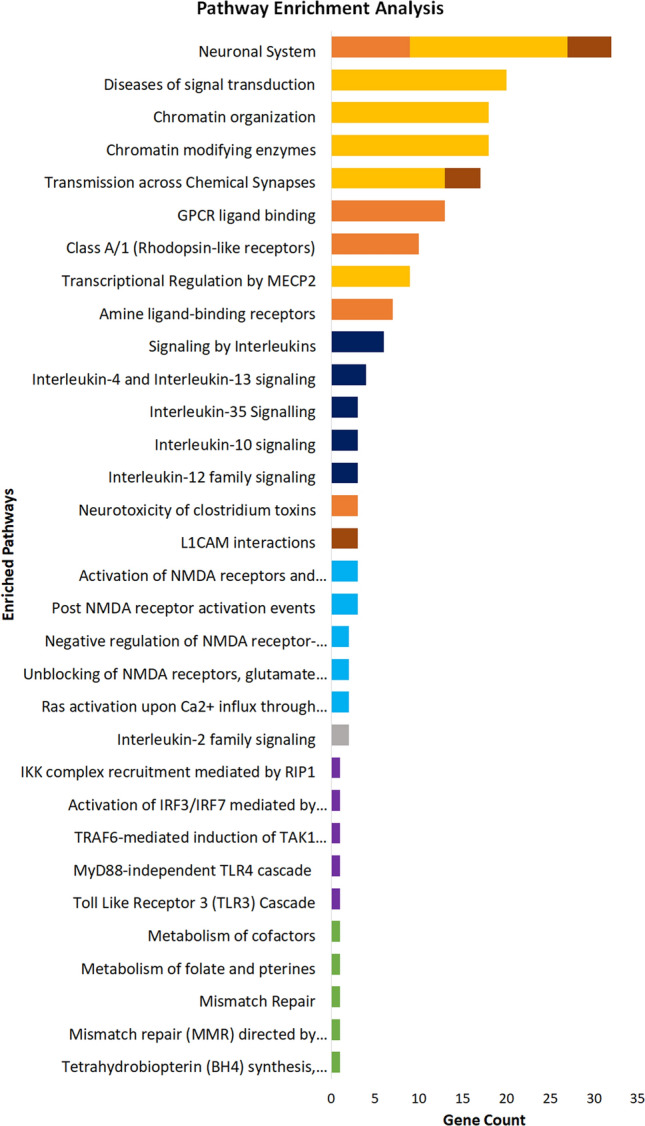
Figure 5.

Pathway enrichment analysis of neuropsychiatric and neurological disorders using ReactomePA. Bar plot of the 5 most significant results from pathway enrichment analysis of each neuropsychiatric and neurological datasets after Matrix-GC. The following disorders are represented: attention deficit hyperactivity disorder (ADHD, Orange), bipolar disorder (BIP, Brown), Alzheimer’s disease (AD, Grey), multiple sclerosis (MS, Dark Blue), Parkinson’s disease (PD, Light Blue) Huntington’s disease (HD, Green) and amyotrophic lateral sclerosis (ALS, Purple), autism database (ASD-SFARI, Yellow). Full statistical results from ReactomePA can be found in the Supplementary Information files. Control permutation analysis was carried out on randomly generated and size-matched, from hg19 human reference genome and exome subset.
