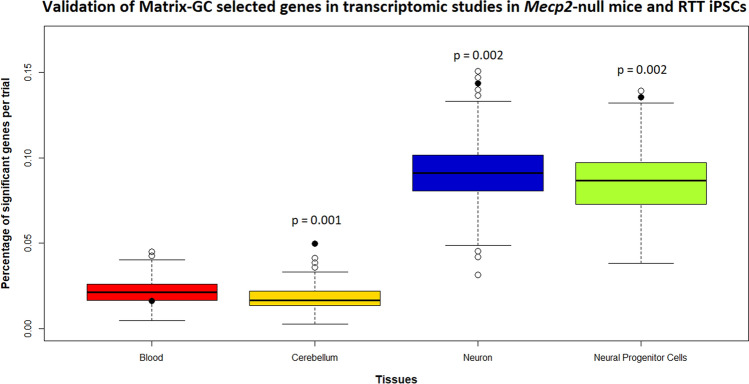
Figure 6.
Validation of Matrix-GC selected genes in transcriptomic studies in Mecp2-null mice and RTT iPSCs. Distribution of significant genes (vertical axis, in percent) against experimental groups (horizontal): blood in Mecp2tm1.1Bird mice (Red), cerebellum in Mecp2tm1.1Bird mice (Yellow), iPSCs-derived neurons from RTT patient (Blue, MECP2 Del ex 3–4 mutation), iPSCs-derived Neural Progenitor Cells from RTT patient (Green, MECP2 Del ex 3–4 mutation). Monte Carlo permutation analysis yields the percentage of significant genes (p value ≤ 0.5) on 1000 randomly generated and sized-matched control gene-sets. The line within the box represents the median of the distribution. The top and bottom edges of the box represent the 3rd quartile (Q3) and 1st quartile (Q1) respectively. The upper and bottom whiskers represent Q3 + 1.5 times interquartile range, and Q1 – 1.5 times the interquartile range. Empty circles represent the outlier observations in each group, solid circles the percentage of Matrix-GC filtered genes in each group. p values are reported above groups where Matrix-GC filtered genes are significant among controls.

