
FIGURE 10.
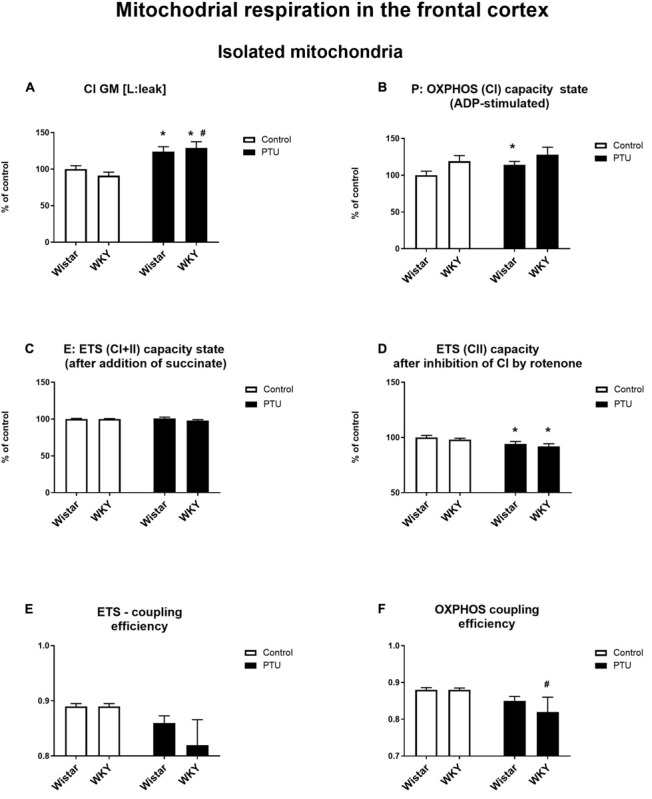
The effects of strain and PTU treatment on the mitochondrial respiration of isolated mitochondria in the frontal cortex: leak state (A), OXHPOS (CI) capacity state (B), ETS (CI + CII) capacity state (C), ETS (CII) capacity state (D), ETS—coupling efficiency state (E), and OXPHOS—coupling efficiency state (F). The results are expressed as the average fold change ± SEM (A–D) or as the mean ± SEM. *p < 0.05 vs. the control group (Wistar rats); #p < 0.05 vs. the WKY group. n = 8–10.