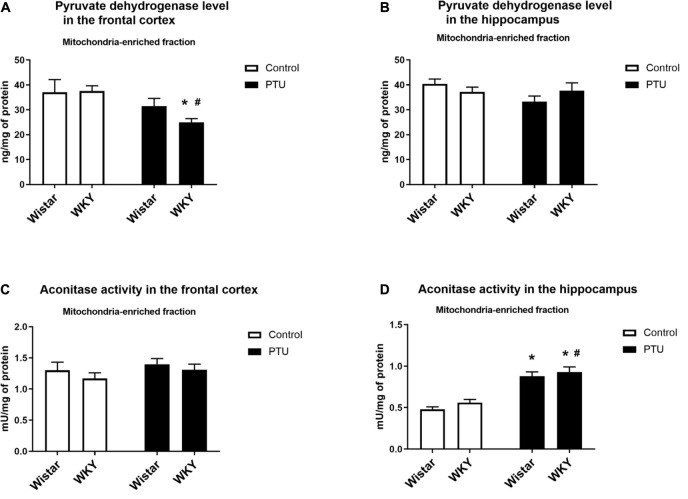
FIGURE 7.
The effects of strain and PTU treatment on the pyruvate dehydrogenase level (A,B) and aconitase activity (C,D) in the mitochondria-enriched fraction of the frontal cortex and hippocampus. The results are expressed as the mean ± SEM. *p < 0.05 vs. the control group (Wistar rats); #p < 0.05 vs. the WKY group. n = 7–10.

