Fig. 4.
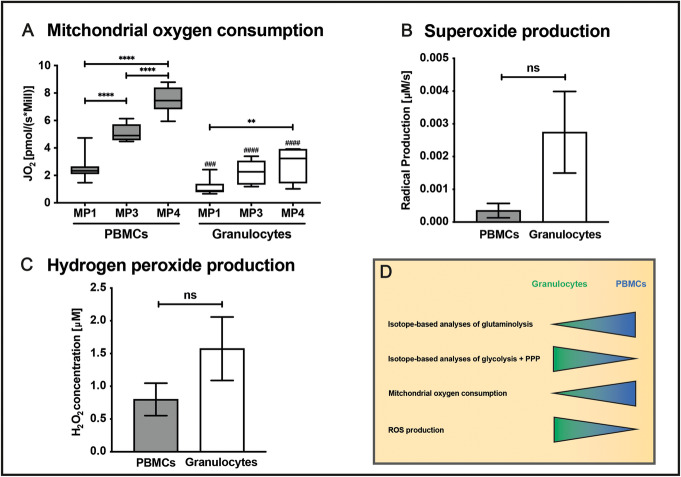
Assessment of immune cell metabolism. Panel a shows the mitochondrial oxygen consumption in a porcine model of acute subdural hematoma combined with hemorrhagic shock assessed in the uncoupled state (electron transport system capacity) before (MP1), as well as 12 (MP2) and 24 h (MP3) after trauma induction in PBMCs (gray bars) and granulocytes (white bars). 10 × 106 cells/1 mL RPMI medium were added to the measurement chamber of the Oxygraph O2K (Oroboros Instruments, Innsbruck, Austria) which measures oxygen concentration with a Clark electrode. After addition of the ATP synthase inhibitor oligomycine (0.5 μL of a 0.5 μM stock solution), the uncoupling agent FCCP (0.5 μL of a 0.5 μM stock solution) was added stepwise to reach the level of maximum oxygen consumption (electron transfer system capacity). b O2− production quantified by electron spin resonance spectroscopy in PBMCs (gray bars) and granulocytes (white bars) isolated from pigs before trauma induction. Therefore, 2.5 × 10⁶ cells (in 1 mL RPMI) were mixed with the superoxide-targeted spin probe CMH. A serial measurement over 30 min enables calculation of superoxide radical production rate. An equally treated sample of RPMI with CMH served as blank value that was subtracted from the cell suspensions’ production rate. c Before trauma induction, H2O2 production of 1 × 10⁶ PBMCs (gray bars) and granulocytes (white bars) in 2 mL RPMI medium was electrochemically quantified with a Pt-black modified microelectrode. The data presented in b and c are adapted from [72]. d outlines the concept for our methodical approach to analyze the energy metabolism in granulocytes and PBMCs. Usually, granulocytes preferentially utilize glucose to produce ATP and have a low mitochondrial oxygen consumption but a high ROS production. PBMCs on the other hand prefer glutamine over glucose utilization, have a higher mitochondrial oxygen consumption and low ROS production. It is important to note that the metabolic pathways shift depending on the state of activation and that immune cells use different substrates (fatty acids, amino acids) in order to safeguard ATP homeostasis. Data are presented as a median with interquartile range and b, c mean with SD, *p < 0.05; **p < 0.01; ***p < 0.001; ****p < 0.0001; ###p < 0.001 vs PBMC; ####p < 0.0001 vs PBMC; according to a a 1-way ANOVA and Tukey’s multiple comparisons test, n = 6–14, and b Wilcoxon signed-rank test, n = 7–9, c n = 3 per group. Abbreviations: ATP, adenosine triphosphate; CMH, 1-hydroxy-3-methoxycarbonyl-2,2,5,5-tetramethylpyrrolidine (spin probe); FCCP, carbonyl cyanide-4-(trifluoromethoxy)phenylhydrazone (uncoupling agent); MP, measurement timepoint; PBMCs, peripheral blood mononuclear cells; Pt-black, platinum black; ROS, reactive oxygen species; SD, standard deviation

