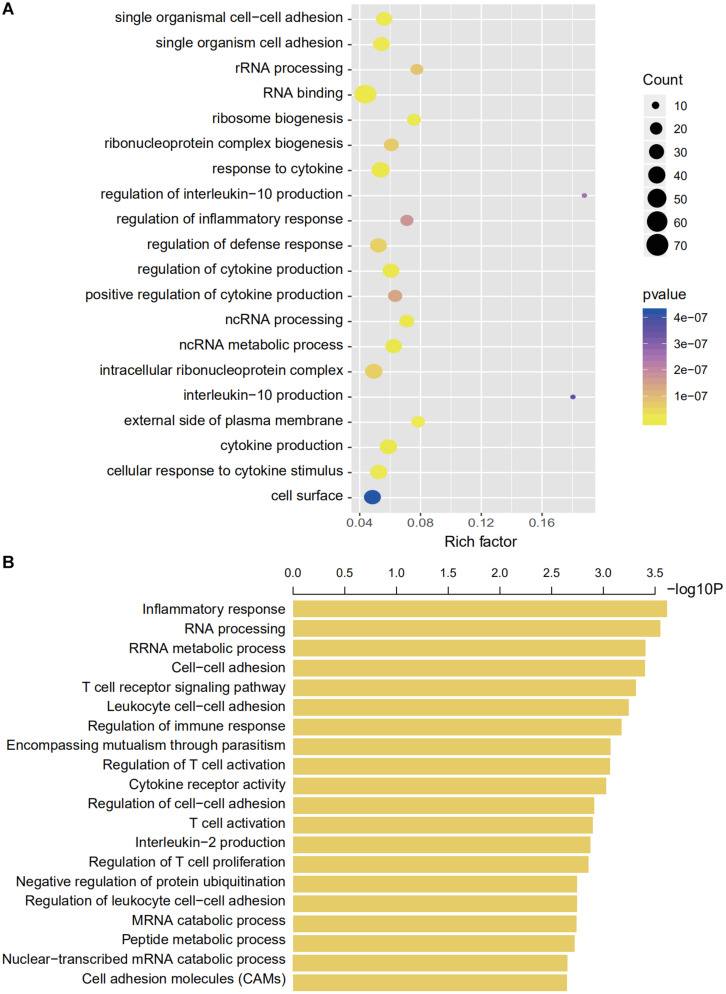
FIGURE 6.
Gene enrichment and functional analyses using co-expressing genes. (A) Gene enrichment analyses using co-expressing genes. The colors of the dots represent the statistical correlation with the selected IRGs. The size of the dots indicates the number of associated genes. (B) Functional enrichment analyses of co-expressing genes.

