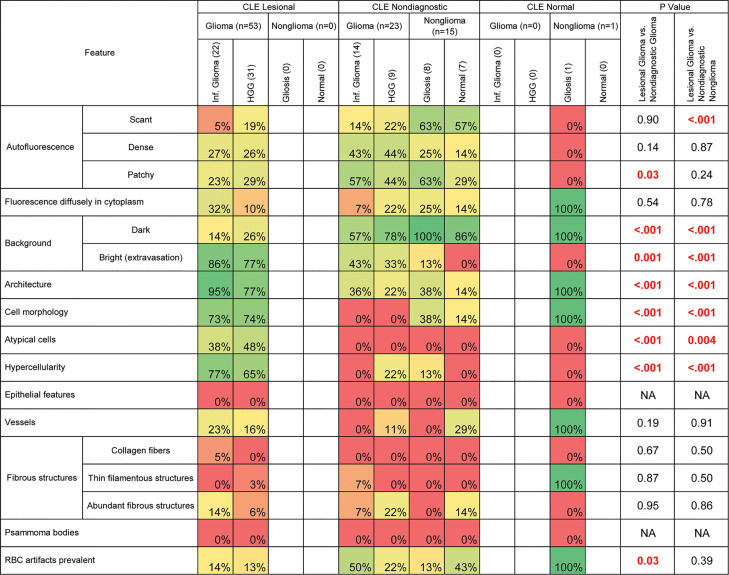
Figure 3.
Prevalence of histologic features among gliomas and normal or reactive brain tissue specimens. This analysis excluded 2 confocal laser endomicroscopy (CLE) optical biopsies with false-positive results, 2 CLE optical biopsies with false-negative results, and 1 nondiagnostic sample stained with hematoxylin-eosin. Table cells are shaded to reflect the prevalence of the specified feature among each group of specimens on a spectrum from red (0%) to green (100%). Boldface type indicates statistical significance. HGG, high-grade glioma; NA, not available; RBC, red blood cell. Used with permission from Barrow Neurological Institute, Phoenix, Arizona.

