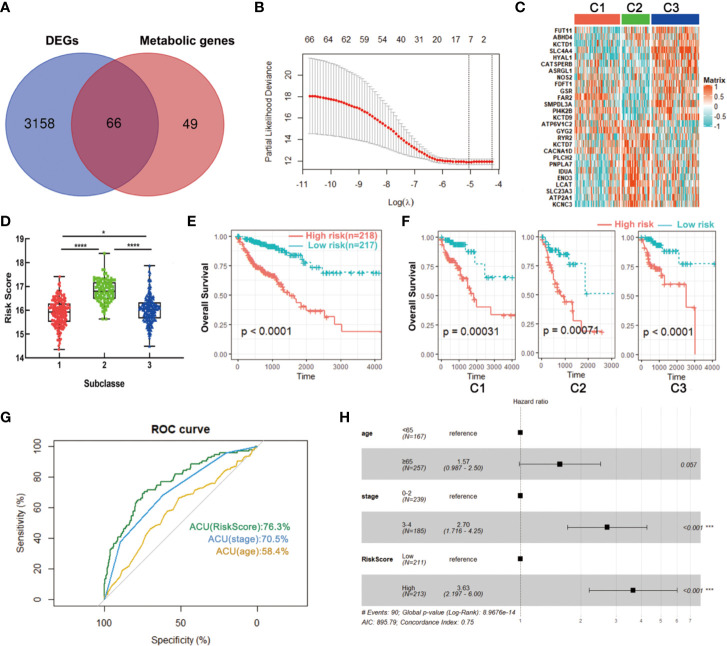
Figure 8.
Identification of a metabolism-related signature by LASSO regression model. (A) Venn diagram of DEGs among three subclasses which are prognosis-related metabolic genes. (B) Cross-validation for tuning parameter selection in the proportional hazards model. (C) Heatmap of the expression levels of signature genes. (D) Distribution of risk scores in CRC subclasses. (E, F) Survival analysis of the metabolism-related signature in CRC or CRC subclasses. (G) ROC curve analysis of age, stage and risk score. (H) Multivariate Cox regression analysis of age, stage and risk score. *P < 0.05, ***P < 0.001, ****P < 0.0001. AUC, area under the curve.

