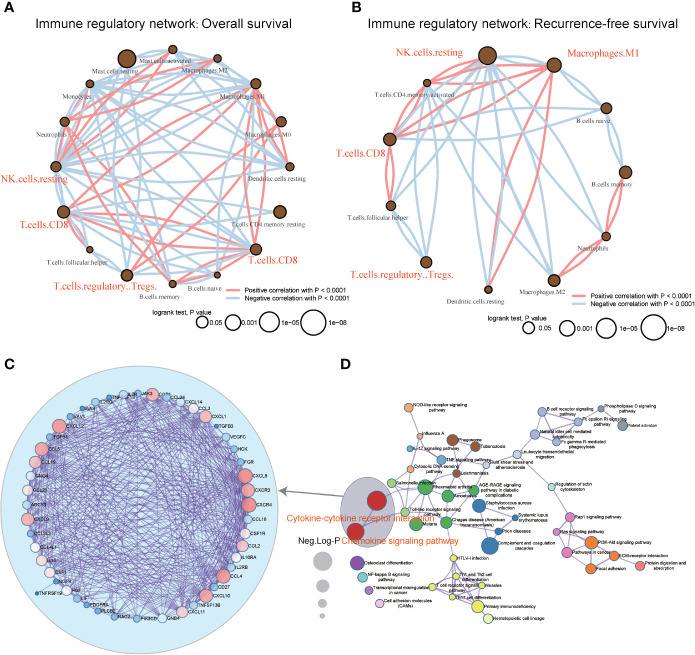
Figure 3.
Construction of immunocyte regulatory and KEGG. pathway networks with respect to the LIHC immunological microenvironment (A, B) Immunocyte infiltration regulatory network analysis of TCGA-LIHC data in response to overall and recurrence-free survival. The dot size represents the log rank test p-value. (C) After filtering the genes in primarily enriched pathway terms, the hub gene PPI network was generated. The size of the font represents the node degree, and the color of the dots represents the closeness-centrality. (D) The network of KEGG pathways was identified using the MetaScape database. The sizes of the dots represent the enrichment score.

