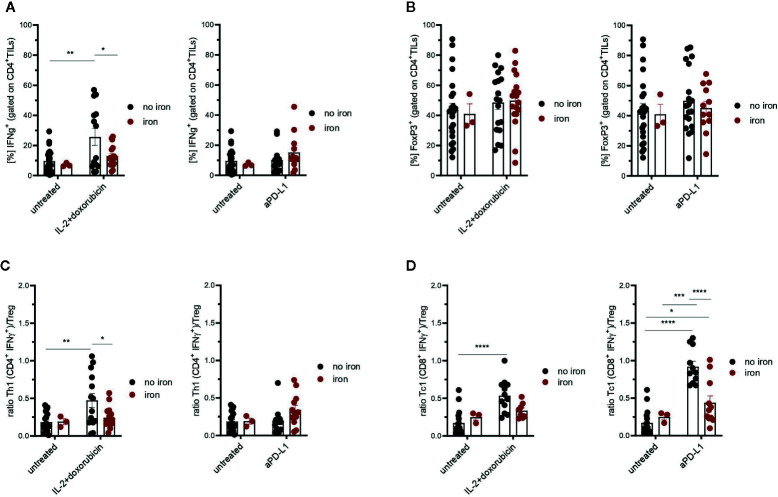
Figure 4.
Effects of intravenous iron on CD4+ TILs (A), regulatory T cells (B) and Th1/Treg or Tc1/Treg ratios (C, D) in immunotherapy and chemoimmunotherapy of mouse mammary carcinomas. Ratios Th1/Treg (C) and Tc1/Treg (D) were calculated. Representative plots are shown (mean ± SEM). Statistical significance was determined by 2-way ANOVA. The results of Tuckey post-hoc-test are presented in the plots: ns: not significant, *p < 0.05, **p < 0.01, ***p < 0.001, ****p < 0.0001. untreated n = 24, untreated + iron n = 3, IL-2 + doxorubicin n = 14, IL-2 + doxorubicin + iron n = 17, aPD-L1 n = 13, aPD-L1 + iron n = 12. The results of ANOVA are presented in Materials and Methods/Specific statistical data analyzed in main figures.

