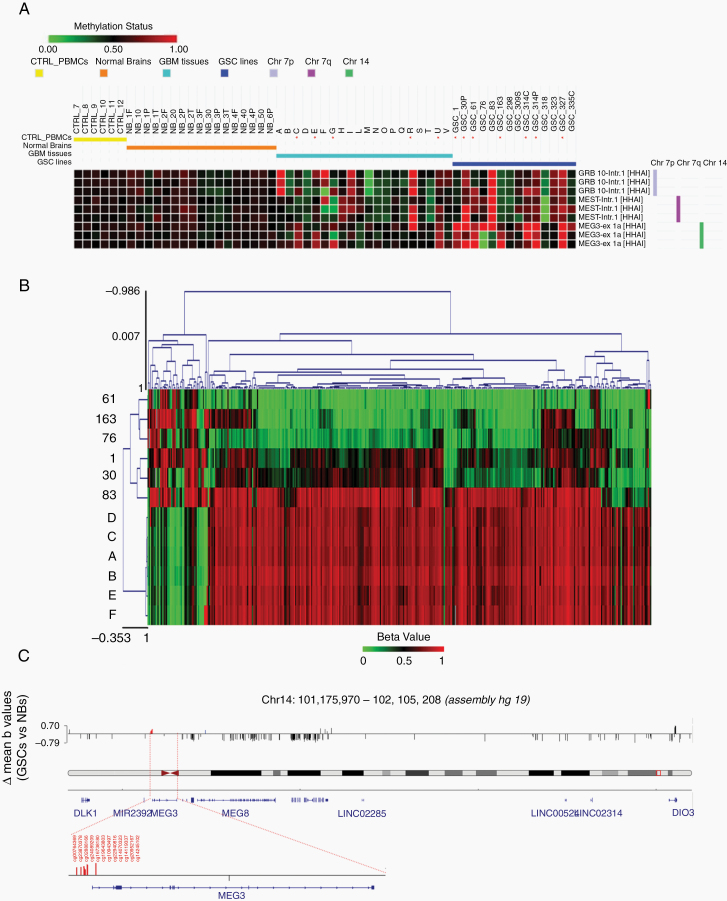
Fig. 2.
Analysis of methylation pattern of DLK1-DIO3 region. (A) Annotated heatmap of chromosome 7 and 14 probes informative for methylation status. MS-MLPA analysis was performed on HhaI digested DNA from 20 GBM tissue specimens, 14 GSC, 6 normal brains (NB) and 6 peripheral blood mononuclear cell (PBMC) samples from normal controls (CTRL). For NBs, the region of origin of the sample is shown: F = frontal, O = occipital, P = parietal, T = temporal; for some samples, multiple regions were examined. Probes are named by gene and position (Intr = intron, ex = exon). For further information about probe genomic positions, please refer to MRC-Holland Salsa MS-MLPA probemix ME032-A1 UPD7/UPD14—description version 05;10–12–2014. Hypermethylated samples are marked with an asterisk (*). (B) Heatmap generated starting from the beta values of the CpGs associated to the DLK1-DIO3 region, considering Illumina array 450k methylation data. The samples (A to F: Normal Brains; #1, #30p, #61, #76, #83 and #163: GSC lines) have been clustered using the Euclidean distance metric. (C) Integrative Genomics Viewer (IGV) screenshot of all significantly differentially methylated Infinium probes (P < 0.01) in the DLK1-DIO3 genomic region. In red are highlighted the 12 CpG probes within MEG3-DMR, while in blue is highlighted one CpG probe (cg16126137) within the putative MEG8-DMR.

