Fig. 3.
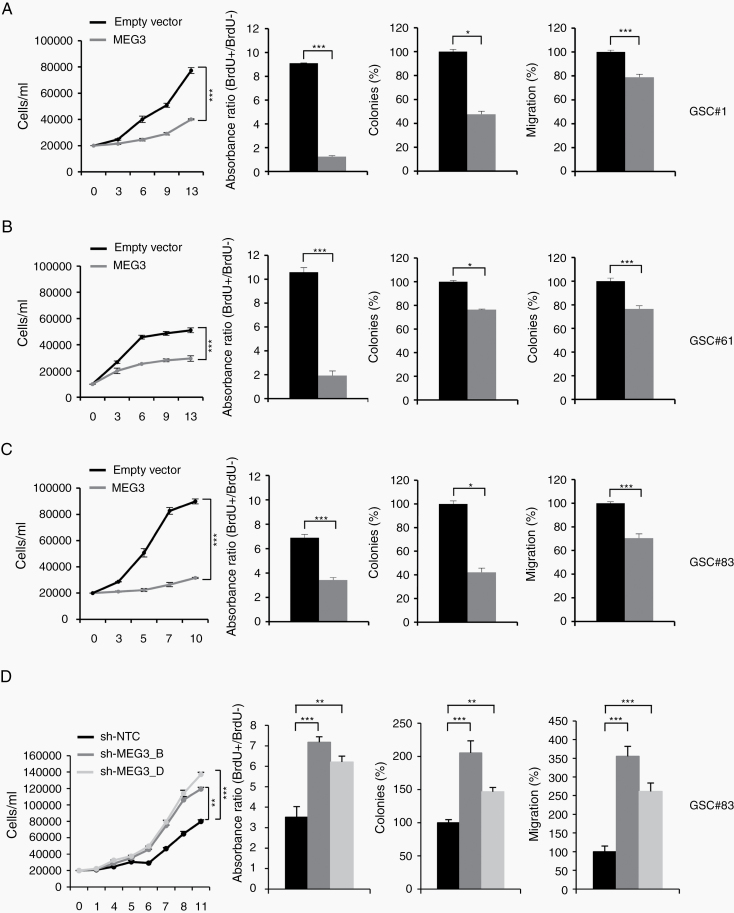
MEG3 tuning modulates cell growth, migration and clonogenic abilities of GSCs. Functional in vitro assays on (A) GSC#1 (B) GSC#61, and (C) GSC#83 cell lines transduced with either empty or MEG3 vectors. Growth curves of GSCs (left panels). Points and range lines at each day represent mean and SD of at least 2 independent experiments in triplicate. Two-way analysis of variance for repeated measures was performed on the whole set of data. BrdU incorporation after 72 h pulse in empty vector and MEG3 transduced GSC lines (center-left panels). Absorbance (450–550 nm) has been shown as ratio between BrdU + and BrdU− wells. Values are reported as mean ± SD from 2 independent experiments in triplicate. Analysis of efficiency in colony formation of GSCs after transduction with MEG3 (center-right panels). Percent colony number values from 2 independent experiments in duplicate were calculated over the correspondent empty vector and are shown as mean ± SD for each GSC line. Analysis of variance demonstrated a significant effect of the restoration of MEG3 on the colony-forming ability of GSCs. Analysis of migration efficiency in GSCs transduced with MEG3 48 h after induction (right panels). Values are reported as percent relative to control vector and shown as mean ± SD from 2 independent experiments in duplicate. (D) Functional in vitro assays on GSC#83 transduced with sh-NTC, sh-MEG3_B or sh-MEG3_D vectors.

