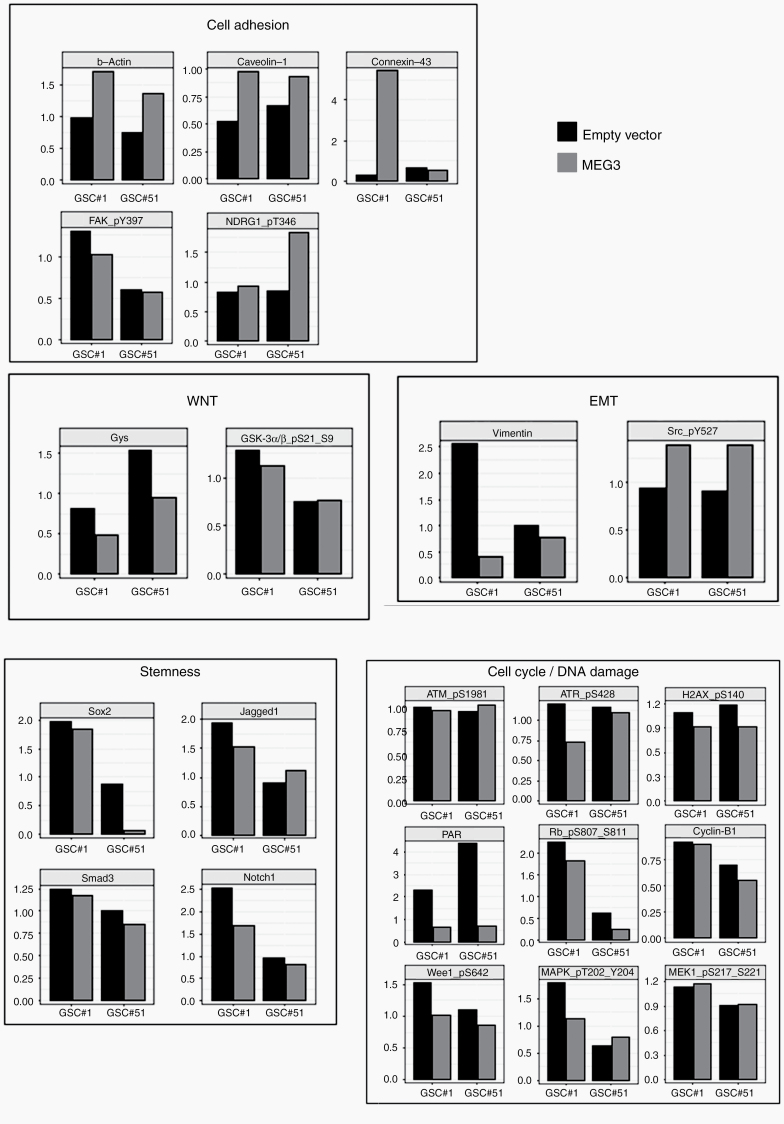
Fig. 6.
Targeted pathway analysis on GSCs. Normalized, relative protein expression levels as measured by RPPA analysis on control and MEG3-overexpressing GSC#1 and GSC#61. Barplots of selected, functional protein endpoints are grouped by pathway, as reported in Supplementary Table 2.

