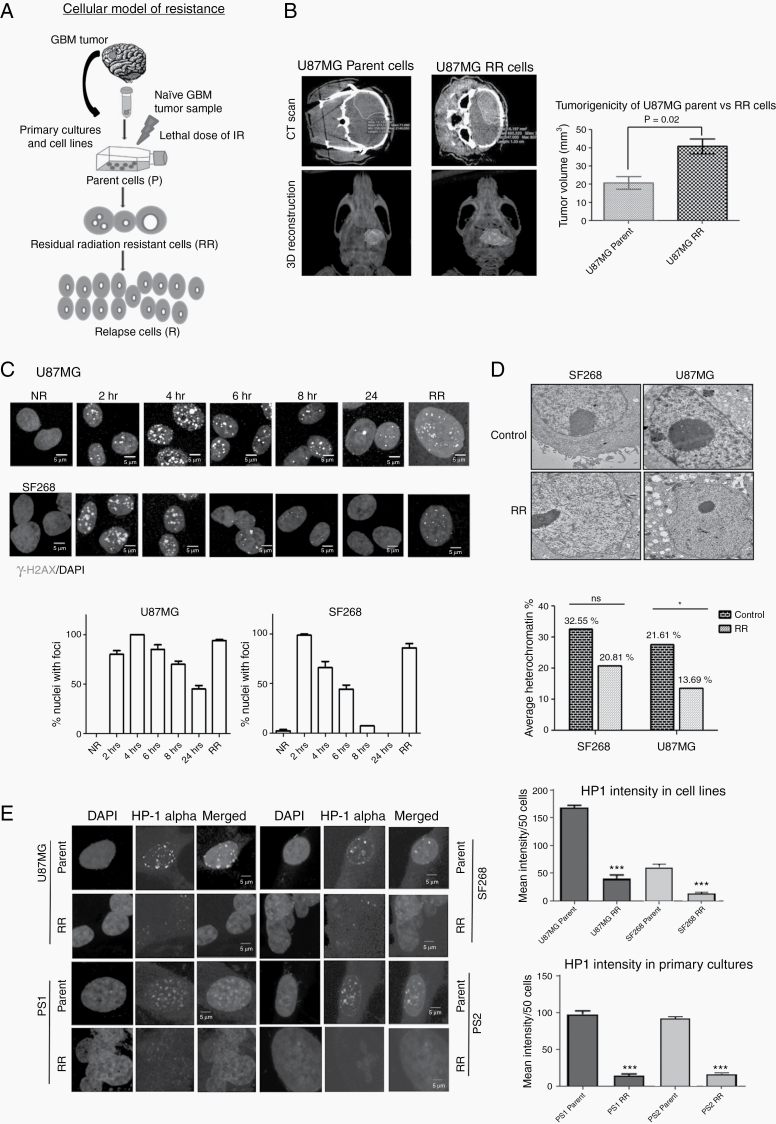
Fig. 1.
Residual cells show euchromatization and tumorigenic in vivo. (A) Schematic representation of the in vitro cellular model developed using primary brain tumor samples and cell lines. (B) CT images (upper panel) of mouse brain orthotopically injected with parent and RR cells. 3D reconstruction (lower panel) of the CT images. Graph represents quantitation of tumor volume as calculated from CT images from mice (n = 3). (C) Immunofluorescence of gamma-H2AX (green) and nuclei counterstained with 4′,6′-diamidino-2-phenylindole (DAPI) in U87MG and SF268 cells at different time points as indicated post irradiation. NR, non-radiated. Graphs represent % of cells with foci from each population (scale bar = 5 µm). (D) Transmission electron micrograph of control and RR cells of U87MG and SF268 showing euchromatin and heterochromatin (dark staining). Bar graph quantifies % heterochromatin from electron microscope images. (E) Immunofluorescence of HP1 alpha (green) in parent and RR cells of indicated cell lines. Nuclei were counter stained with DAPI (blue). Scale bar 5 μm. Bar graph shows mean fluorescence intensity of HP1 alpha staining in at least 50 cells. Intensities were calculated by ImageJ software. All data are represented as means ± SEMs. P-value of ≤0.05 in a paired 2-sided nonparametric t-test was used to test for statistically significant differences. Results in bar graph are the composite data from 3 independent experiments (mean ± SEM); *P ≤ 0.05, **P ≤ 0.01, and ***P ≤ 0.001.

