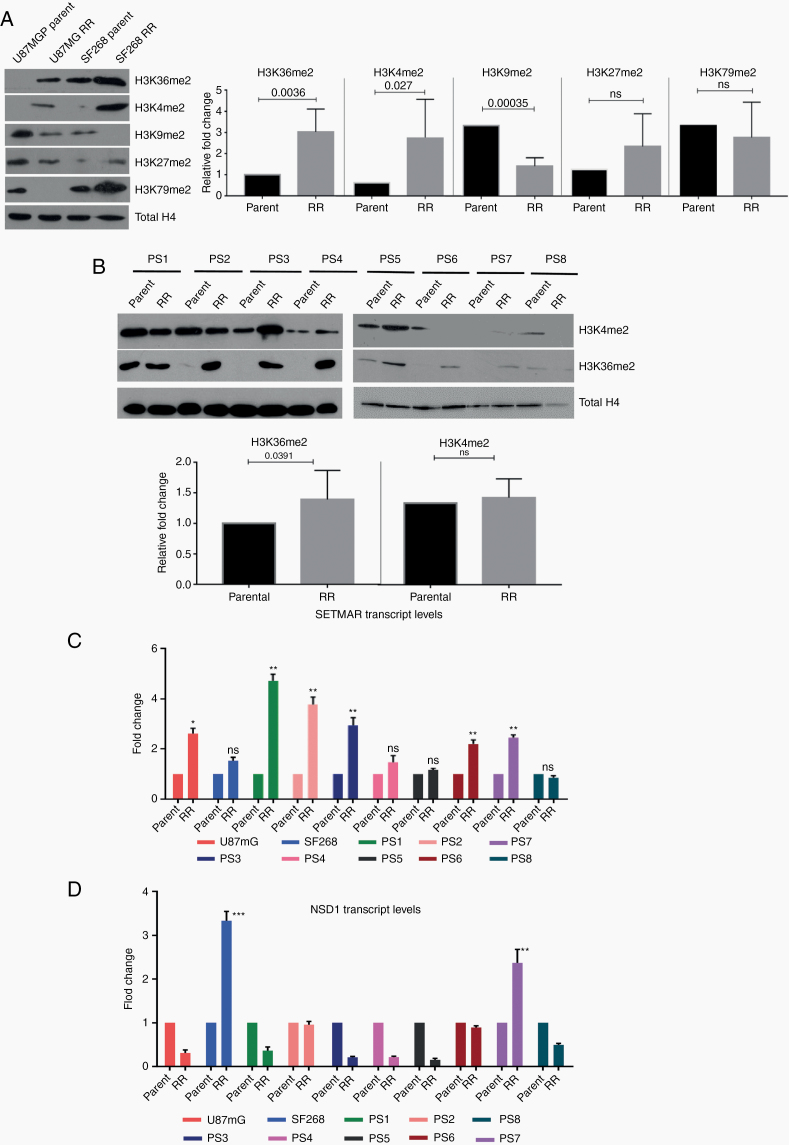
Fig. 3.
Residual cells show high levels of H3K36me2 and upregulation of SETMAR. (A) Western blot for histone modifications (H3K36me2, H3K4me2, H3K9me2, H3K27me2, and H4K79me2) in parent and RR cells of U87MG and SF268 cell lines. Total H4 was used as loading control. Graphs show the results of Wilcoxon matched-pair signed rank test between parent and RR population of respective cell lines for H3K36me2, H3K4me2, H3K9me2, H3K27me2, and H3K79me2. (B) Western blot for H3K36me2, H3K4me2 in parent, and RR cells of patient samples (PS1–PS8). Total H4 was used as loading control. Graphs shows the results of Wilcoxon matched-pair signed rank test between parent and RR population of respective primary cell lines for H3K36me2 and H3K4me2. (C, D) Graphs represent fold change differences in the expression of SETMAR and NSD1 transcripts in RR cells as compared with the corresponding parent cells of U87MG and SF268 and patient samples (PS1–PS8) determined using quantitative PCR analysis. All data are represented as means ± SEMs. P-value of ≤0.05 in a paired 2-sided nonparametric t-test was used to test for statistically significant differences. Results in bar graphs (C–D) are the composite data from 3 independent experiments (mean ± SEM); *P ≤ 0.05, **P ≤ 0.01, and ***P ≤ 0.001.

