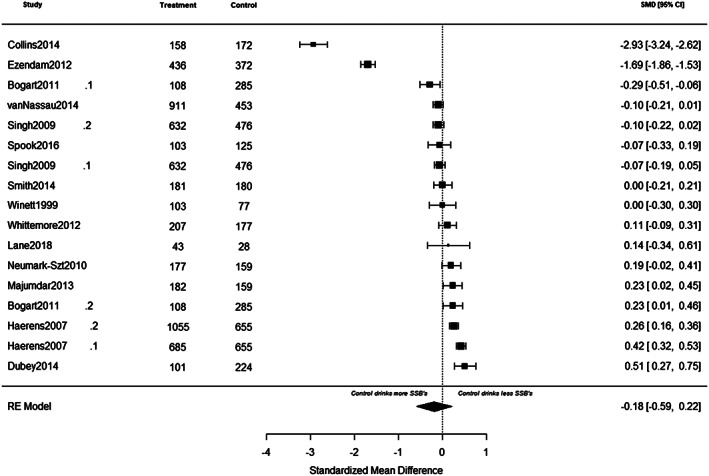
FIGURE 5.

A summary of individual study effects at pre‐intervention. The comparison between intervention and control groups at pre‐intervention are derived from separate random‐effects models. Hedges' g point estimates are represented by filled squares, and the filled diamond represents the estimated summary effect sizes (standardized mean difference). Error bars and diamond width represents the 95% confidence intervals. Positive values represent favouring the intervention whereas negative values represent favouring the control groups
