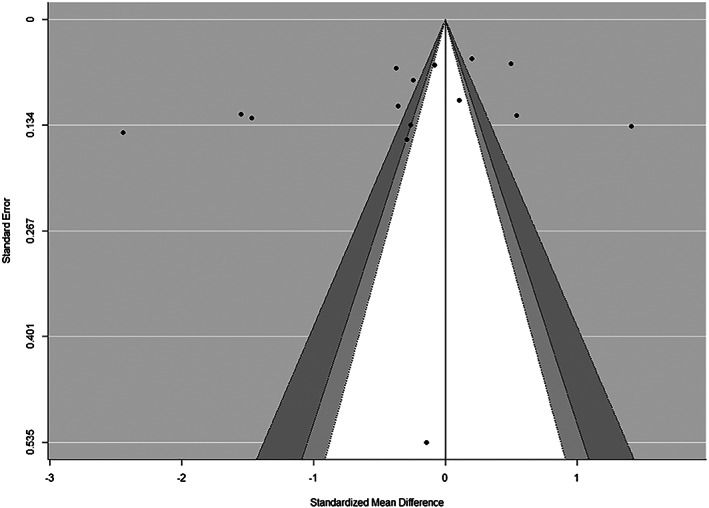
FIGURE 8.

Contour‐enhanced funnel plots for sugar‐sweetened beverage (SSB) intake at post‐intervention. In these plots, individual study effect estimates are plotted against standard errors to determine whether statistically significant studies are overrepresented in the included studies. The light grey area denotes p values between 0.1 and 0.05, the dark grey region captures p values between 0.05 and 0.01, and the white region includes p values greater than 0.1. Because there is no overrepresentation of studies within the light and dark grey regions, this is suggestive of low/no publication bias
