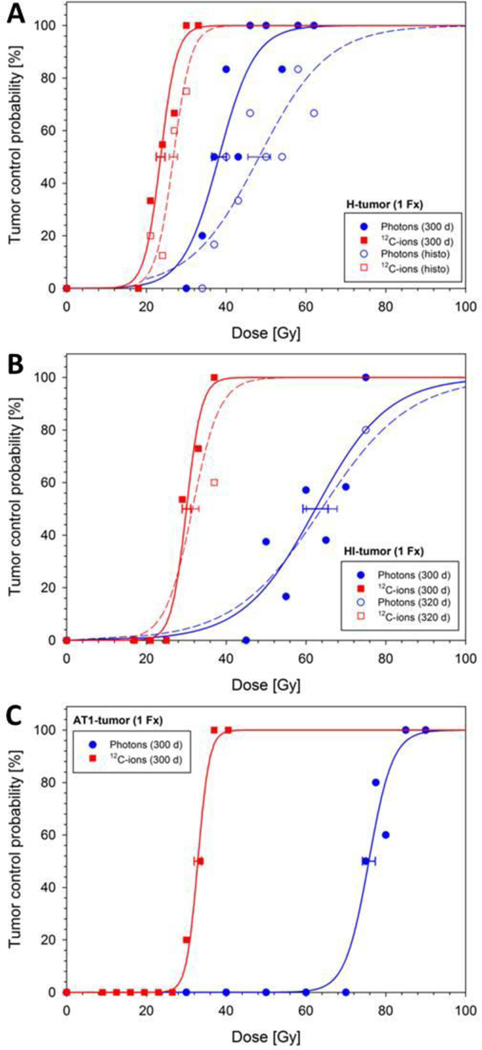
Figure 1:
Dose-response curves of three sublines of the R3327 prostate carcinoma after single fractions of photons and 12C-ions, respectively. The uncertainty (1 SE) of TCD50 is indicated. Solid lines refer to the primary endpoint “local tumor control within 300 d”. As additional endpoints “histological tumor control” (H-tumor, A) and “local control within 320 d” (HI-tumor, B) were used. For comparison, the previously measured dose-response curves for the AT1-tumor (C) [11] are also displayed.

